


 Author Affiliations
Abstract
Background: Maternal and neonatal healthcare is a critical component of overall health services, and its quality profoundly influences health outcomes. This study examines the quality of basic maternal and neonatal care signal functions and assesses clients’ perceptions of care in health facilities in Malawi, utilizing data from the 2013-2014 Malawi service provision assessment (MSPA) survey.
Methods: A cross-sectional analysis was conducted using nationally representative data from the MSPA survey of 2013-14. Key signal functions related to essential maternal and neonatal care were evaluated, encompassing antenatal care, emergency and basic maternal and newborn care, and essential newborn care. Additionally, clients’ perspectives on the antenatal care (ANC) received through exit interviews were analyzed. Statistical techniques, including descriptive statistics and multivariate regression models, were employed to identify factors influencing the observed variations in care quality and client satisfaction.
Results: We found that most facilities do not have all the signal functions, with 66.75% for public facilities and 77.5% for private facilities. We also discovered that hospitals performed better than health centers and clinics. We also noted the presence of minor differences between public and private facilities. Generally, we found that for both facility managing authority types of facilities scored poorly in availability of basic quality of maternal and neonatal care signal functions, and there are no significant differences in availability of basic quality of maternal and neonatal care signal functions in the country. Client’s perceptions on facility quality of services through ANC exit interviews were not consistently supported by the services provided.
Conclusion: This study contributes essential insights into the state of maternal and neonatal health care in Malawi, emphasizing both clinical signal functions and client perspectives. The results have implications for shaping policies and interventions aimed at improving the quality of maternal and neonatal care, ultimately enhancing health outcomes in Malawi.
Keywords
Maternal health, Neonatal health, Signal functions, Healthcare quality, Client perceptions, Malawi service provision assessment.
Introduction
The target of reducing the high burden of preventable maternal and neonatal deaths remains a paramount health-related goal in the sustainable development era. The United nation adopted sustainable development goals (SDGs) in September 2015.[1] In the adoption of these SDGs, the United Nations reaffirmed the reduction of maternal and newborn mortality as a global priority in the coming decades. Globally, the maternal and newborn mortality has reduced; however, only 9 out of 95 countries with high maternal mortality achieved the previous set target of Millenium development goals (MDGs) of 75% reduction in the maternal mortality ratio from 1990 to 2015.[1-3] About 830 women die every day from pregnancy and childbirth-related complications, of which 99% occur in low-income and middle-income countries, and more than 50% in sub-Saharan Africa.[4] There is marked evidence showing that the largest burden of maternal death is clustered within the time of childbirth and the immediate postpartum period.[5] The SDGs’ targets are set to reduce maternal mortality to fewer than 70 deaths per 100,000 livebirths and deaths of newborn babies to fewer than 12 per 1000 livebirths by 2030.[6,7] Currently, Malawi maternal mortality ratio is estimated at 439 maternal deaths per 100,000 live births, and neonatal mortality ratio at 27 deaths per 1000 live births, and more of these deaths occur in public facilities than in private facilities.[8]
As a result of a global advocacy for skilled attendance at each birth to reduce preventable maternal deaths during the millennium development goals era, there was a significant increase in the access and uptake of childbirth services globally including in sub-Saharan Africa(SSA) countries like Malawi.[9,10] However, this did not support the expected reduction in maternal, infant, and neonatal mortality rates in low-resource settings.[11] Maternal and newborn outcomes will improve only if a skilled birth attendant and health facility delivery encompass the implementation of proven effective interventions needed to prevent or manage major causes of maternal and newborn morbidity and mortality. These principles are challenged if the quality of care is substandard.[12]
Quality of care is defined as a proper performance according to standards of interventions that are known to be safe, affordable to society, and that could produce an impact on mortality, morbidity, and disability. The poor quality of care in health facilities in low-resource settings represents a neglected agenda and is a major contributing factor to persistent high levels of preventable maternal and newborn morbidity and mortality.[13] The central point in the achievement of global commitment towards universal health coverage (UHC) lies in closing the gaps in the provision of quality care.[14] Making high-quality healthcare services accessible to individuals and communities to meet their health-related needs without experiencing financial hardships is one of the UHC pillars. Quality of care is a complex phenomenon, and it encompasses various approaches and dimensions. Quality of maternal and newborn care is normally assessed through delivery outcomes or the availability of resources needed to implement effective interventions, and using process indicators.[14-16]
Availability and quality of maternal care services have been evaluated using emergency obstetric care (EmOC) signal functions, the interventions that treat the main causes of maternal mortality.[16] The recent addition of neonatal resuscitation to these signal functions acknowledges the continuum of care between mother and baby; however, availability of neonatal resuscitation alone does not adequately capture a facility’s capacity to respond to newborn emergencies.[17] Furthermore, the focus on EmOC has been accompanied by a relative neglect of routine or preventive delivery and postnatal functions, despite clear standards of good clinical practice and the potential to prevent complications from arising.[18]
Six components (building blocks) of quality of care for maternal and newborn health outlined by World health organization(WHO) quality of care framework includes service delivery; health workforce; information; medical products, vaccines and technologies; financing; and leadership and governance (stewardship) and a few highlights on patient experiences.[19] The patient experience quality domain has not been fully studied despite evidence of its vital importance in the provision of quality healthcare services. The research has also indicated that women’s decisions on where to go for health care services, especially for a delivery, are influenced by the types of interactions they have had with providers in the past, and their perceptions of the quality of care provided to them. A cross-sectional study done in Kenya also indicated that women who had poor perception of quality of ANC services at facility were more likely to start ANC visits late Another study done in Kenya found out that there is a little association between women’s reports of their care and observed indicators of care received during labor and delivery or ANC. In the analysis study done by Diamond-Smith et al in Kenya and Namibia, it was also found that patient perceptions were not associated with basic quality measures of services provided by facilities. Kambala C et al. in the study of experience and perception of Malawian women on maternal and newborn care, found out that a high perceived quality of care rating was based on interpersonal relations, conditions of the examination rooms, and nursing care services provided. It was also observed that self-introduction by the health worker, explanation of examination procedures, consent seeking, encouragement to ask questions, confidentiality protection, and being offered to have a guardian during delivery were associated with a high-quality rating of interpersonal relations for antenatal and delivery care services. In the same study, being literate, never experiencing a stillbirth, and first ANC visit were associated with a high-quality rating of room conditions for antenatal care services.[20-22]
MSPA was carried out in 2013-2014 as part of phase six of the demographic and health survey (DHS) series. SPA surveys are carried out regularly to collect data on resource availability from all health facilities in Malawi. The high-quality data produced by SPA surveys has been used by many scientific researchers studying health-related outcomes. This analysis used Malawi SPA survey data from 2013 to 2014 to compare indicators of antenatal, maternal, and neonatal emergency care between public and private health facilities in Malawi. We also compare the distribution of services provided by hospitals, health centers, and other facilities, in both private and public facilities. Lastly, we also explore the correlation between respondents’ reports of complaints experienced in their ANC visits (from exit interviews), the services they received, and the type and ownership of the facility they attended.
Methodology
We conducted a secondary data analysis of the Malawi SPA. The SPA, conducted in June 2013 – February 2014, included all public facilities, non-governmental organization (NGO) facilities, private-for-profit, faith-based facilities, and facilities managed by corporate entities. The survey tools included quality of service delivery functions indicators for labour and delivery care, post-natal and immediate neonatal care, and antenatal care. SPA surveys are nested within selected DHS that have been conducted in several countries in Africa. The DHS and SPA are cross-sectional, nationally representative surveys. They use model questionnaires, which can be adapted by each country. The survey tools included inventories of clinical services and interviews with providers. Detailed methods are reported in the survey report. This analysis has used data from the service readiness indicators and exit interview modules. Our choice for SPA data was based on high-quality data. The data is also publicly available, the data measures both clinical quality of care and service readiness of maternal and neonatal health, and it has additional exit interview components to compare patient experiences with clinical measures.
A total of 632 facilities were sampled, which included 528 facilities that provide both routine maternal deliveries and newborn care services and antenatal care services, and 104 facilities that provide only antenatal care services. Generally, hospitals were over-sampled because of their small number. These are facilities that the Malawi SPA survey of 2013-2014, done by DHS, captured its data on routine maternal deliveries, newborn care services, and antenatal care services in Malawi. Detailed reports describing details of sampling, fieldwork, and characteristics of respondents can be obtained from the DHS website (measuredhs.com).
This analysis has been done with reference to Nesbitt et al.’s quality index dimensions for maternal care, neonatal care, and antenatal care. This includes quality indicator areas for routine delivery care, EmOC, emergency newborn care (EmNC), and ANC quality index dimensions for maternal and neonatal care. These standards have been used in Kenya, Ghana, and Namibia. They contain indicators for quality of routine delivery care, EmOC, EmNC, and ANC, which include client exit complaint indicators. These standards have a maximum of 12 indicators on routine delivery, 5 indicators on EmNC, 6 indicators on EmOC, and 8 indicators on ANC services (Table 1).[22]
The data mainly used was from three parts of the service readiness indicators, which include data from ANC, delivery care, and neonatal care. “Reported” and “observed” were both acceptable responses for several of the critical indicators. All the analyses were done using weighted data. The percentage of each facility type reporting provision of delivery, neonatal, or ANC services by type of authority or ownership was calculated.
We first had to put the dataset into weighted data form to work out on every variable so that facilities make an equal contribution to the sample. We calculated the percentage of each facility type reporting the provision of delivery or ANC services. All facilities were grouped into two facility ownership categories, public (government-owned) and private, which included christian health association of Malawi (CHAM), private, mission/faith-based, NGO, and company facilities. Facilities were further classified based on whether they had the capacity to function as a secondary care facility (hospital) or a primary care facility (health centre or clinic).
The ANC quality indicators included the tracer indicators of ANC quality assessment, such as indicators for whether the facility screens and treats sexually transmitted infections (STIs), does human immunodeficiency virus (HIV) testing, and whether ANC is offered at least 5 days a week (Table 1). We assume that if a facility is indicated to provide these specific services (routine delivery care, EmOC, EmNC, or ANC), it should have all the recommended quality standards and its components, regardless of facility type, which include a hospital, health center, or clinic. We have presented the indicators suggested by Nesbitt et al.[22] The variable collected in the Malawi 2013-2014 SPA data that we used to measure indicators, and whether and how it differed by facility ownership or managing authority (public or private). Nesbitt also proposed the fourth dimension, a non-medical quality dimension that comprises questions about availability and cleanliness of a toilet with water and soap, hand washing, and whether a woman can have a delivery companion. However, this was not included in this analysis because most of these indicators were not collected in the Malawi SPA surveys of 2013-2014.
| Routine delivery | |||
| Quality index dimensions Indicators (Nesbitt et al.) | MSPA Indicator | (n=347) | (n=181) |
| Monitoring of labour using a photograph | Partograph (observed) | 98 | 98 |
| Infection prevention | Soap and running water, or alcohol-based hand disinfectants (observed) | 71 | 76 |
| Measure blood pressure (BP) | Take BP, routine | 84 | 98 |
| Controlled cord traction | Apply cord traction, routine | 96 | 98 |
| Injection of oxytocin within 1 minute of delivery | Injectable oxytocin/Syntocin, observed, valid date | 98 | 98 |
| Uterine massage | Massage the fundus through the abdomen, routine | 78 | 89 |
| Place the baby on the abdomen | Delivery of baby to abdomen | 98 | 97 |
| Dry baby immediately | Dry and wrap newborns to keep warm | 100 | 100 |
| Apply eye ointment | Apply tetracycline eye ointment to both eyes | 93 | 87 |
| Weighing a baby after delivery | Routine weighing of baby & newborn scale observing | 99 | 99 |
| Initiation of a newborn to Breast feeding within 1 hour | Initiation of breastfeeding within the first 30 minutes | 99 | 99 |
| Delaying bathing at least 6 hours after delivery | Give full bath within minutes/few hours after | 6 | 6 |
| EmOC | |||
| Quality index dimensions Indicators (Nesbitt et al.) | MSPA Indicator | (n=347) | (n=181) |
| Parenteral Antibiotics | Ever or past 3 months: used parenteral antibiotics | 88 | 90 |
| Parenteral Oxytocin | Injectable oxytocin/Syntocinon, observed | 99 | 99 |
| Parenteral anti-convulsing | Injectable diazepam observed, /Injectable magnesium sulfate observed | 93 | 85 |
| Manual removal of retained placenta | Used manual placental removal, past 3 months | 73 | 68 |
| Manual removal of retained products of conception | Past 3 months: retained products extracted | 54 | 46 |
| Instrument delivery | Assisted vaginal delivery (c-s) | 64 | 65 |
| Comprehensive | |||
| Blood transfusion | Provide blood transfusion | 9 | 29 |
| C-section | Use of indictors for “instrument delivery” above | 9 | 9 |
| EmNC | |||
| Quality index dimensions Indicators (Nesbitt et al) | MSPA Indicator | (n=347) | (n=181) |
| Injectable antibiotic for newborn sepsis | Injectable gentamicin observed | 91 | 94 |
| Newborn resuscitation with mask and bag | Infant resuscitation bag/mask or tube/mask) observed | 94 | 91 |
| Kangaroo mother care | Kangaroo mother cares, routine | 55 | 58 |
| Express milk with spoon | Milk expression | 0 | 0 |
| Dexamethasone | Injectable betamethasone/ dexamethasone | 9 | 87 |
| Comprehensive | |||
| IV fluids for newborn | IV fluid Observed /IV infusion set observed | 69 | 80 |
| ANC | |||
| Quality index dimensions Indicators(Nesbitt et al.’s) | MSPA Indicator | (n=399) | (n=233) |
| Guidelines on ANC | ANC guideline observed | 63 | 50 |
| Staff trained in ANC | Staff trained in ANC | 74 | 66 |
| Blood pressure apparatus | Blood pressure apparatus | 52 | 97 |
| Hemoglobin (Hb) | Check Hb, blood tests for anemia | 16 | 60 |
| Urine dipstick- protein | Urine test for protein, routine, observed | 12 | 37 |
| Iron tablets | Iron tablet available, observed | 40 | 43 |
| Folic acid tablets | Folic acid tablets observed | 16 | 24 |
| Tetanus toxoid vaccines | Available every day | 83 | 81 |
| Other quality indicators | |||
| Number of days a week ANC offered | ANC offered 5+ days a week | 34 | 60 |
| Treat STIs | Routinely treat STI | 21 | 36 |
| HIV | HIV testing and treatment | 97 | 90 |
Table 1: Routine maternity delivery, EmOC, EmNC, and ANC quality indicators
Exit interviews with client data from antenatal included questions on the types of services they received, the complaints they reported, how long they had to wait, and whether this facility was the closest facility to their homes. A total of 2069 patients were interviewed through ANC exit interviews in all 632 health care facilities that offer ANC services during the survey, with 1534 patients from public facilities and 535 patients from private facilities. A series of questions was asked to clients on whether they had any complaints about their experience with ANC. The complaint score was formulated from the combination of these complaints. There are no exit interviews with clients after giving birth, and we did not include information on women’s perceived problems after delivery. We later constructed an average complaint score in percentage for each facility equal to the average of the number of complaints listed by each client exiting that specific facility and facility ownership (public/private) after an ANC visit (Table 2).
Patients’ perceived quality of care was measured by the number of complaints that they reported from their ANC visit. We created a facility-level complaint score, which was the average of the scores of all the clients interviewed exiting that facility, and this was one of the main outcomes of interest in the analysis.
| Complaint indicator | Public
(n=1534) |
Private
(n=535) |
| Poor behavior/ attitude of providers | 2 | 2 |
| Insufficient explanation about pregnancy | 2 | 2 |
| Long time to wait to see a provider | 19 | 13.1 |
| Not able to discuss problems with a client | 4 | 4 |
| Medicine not available in facility | 7 | 4 |
| Facility open limited days | 4 | 2 |
| Facility open limited hours | 9 | 9 |
| Facility not clean | 3 | 1 |
| Service costly | 0 | 10 |
| Insufficient visual privacy | 1 | 0 |
| Insufficient auditory privacy | 1 | 1 |
Table 2: Percentage of ANC clients that reported each type of complaint by each managing authority
This analysis involves secondary analysis of a publicly available dataset; therefore, a waiver of approval was obtained from the college of medicine research and ethics committee (COMREC). A letter of authorization to use the Malawi SPA survey data of 2013-2014 was obtained from DHS. Patient consent was not required because this is a secondary data analysis.
Statistical analysis: All analyses were performed using statistical software like Stata 16MP. First, we tested whether service-level measures of ANC quality collected in the service readiness questionnaire were associated with a patient’s perceived quality of their ANC visit, as measured in the exit interviews. Descriptive analyses were performed by facility managing authority type across the country in routine delivery, EmOC, and EmNC quality indicators. To test the associations between quality of services and patients’ perceived quality as measured by the complaint score, we conducted multivariable linear regressions. Analyses were stratified by facility managing authority type (private or public) and clustered at the facility level (hospital, health centre, or clinic). The multivariable regressions included facility managing authority type and service-related factors that could be associated with patients’ perceived quality. Three indicators were included to measure the quality of information or provider interaction (the percentage of clients per facility that the provider asked them if they had any questions while they were at their visit, if the facility offered ANC 5 or more days a week, and if the facility had training materials for ANC). The multivariable regressions also included five service indicators of quality: whether tetanus was available that day, whether urine tests, blood tests, blood pressure, and whether the facility treated STIs. At the end, we conducted multivariable linear regressions for each facility managing authority type (private vs public) looking at the association between type of facility thus a hospital, health center, maternity and clinics and quality indicator scores made by summing the number of indicators in each category (Routine, EmOC, EmNC and ANC).
Results
The number of hospitals, health centers, and other health facilities, including maternity-only facilities, clinical facilities, and health post facilities, varies across regions in the country. The survey included a total of 1060 facilities, and 92% (977) successfully completed the survey. Among these facilities that had a successful complete survey, 17% were from the Northern region, 37% in the Central region, and 46% in the Southern Region. These facilities include 12% hospitals, 28% health centers, 5% dispensaries, 33% clinics, and 2% health posts. 48% were owned or managed by the government, which are also called public facilities, while 52% were owned or managed by the private sector (CHAM, private, NGO, company) with more interest in profit making or specific interests. Of 977 successfully surveyed facilities, 632 of these health facilities representing 65% were able to provide antenatal care service, 528 (54%) health facilities were able to provide labour and delivery care, 69 (7%) health facilities were able to provide caesarian section services, and 528 (54%) health facilities were able to provide both antenatal services and labour and delivery services.
Among 632 health facilities that were able to provide ANC services, 118 were from the northern region, 235 were from the central region, and 280 were from the southern region. 16.3% of these facilities were hospitals, 70.4% were health centres, 2.9% were dispensaries, 10.1% were clinics, and 0.2% were health posts. About 63% (399) of these facilities were managed by the government, and 37% (233) were managed by the private sector (private, NGO, CHAM, company). In 532 facilities that were able to provide routine labour and delivery, 347 (65.7%) were public-owned facilities or under the management of the government, and 181 (34.3%) were under the management of the private sector.
The study found that most of the public health facilities are in the southern region, closely followed by the central region, and the least being the northern region. A good proportion of the facilities owned or managed by the government are for the privately owned facilities in every service provision under the study. The information is clearly shown graphically in Figure 1.
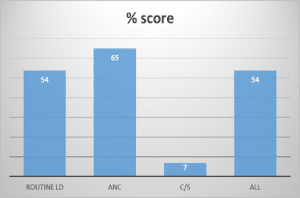
Figure 1: Facilities for routine maternity delivery, ANC, C/Section & both (ANC & routine) in percentage
Performance distribution of basic quality services indicators on routine labour and delivery, EmOC, EmNC, and ANC indicators between public and private facilities. The performance on quality of basic maternal and neonatal care signal functions indicators on routine maternity delivery, EmOC, EmNC, and ANC, differed by facility level (hospital, health centre or clinic), facility type (public or private), and across regions of the country. The distribution of all indicator performances for routine maternity delivery, EmOC, EmNC, and ANC is discussed below for each indicator area of service delivery.
Routine labour and delivery indicators: In terms of overall performance in the majority of routine labour and delivery indicators, private facilities performed better with an average score of 94% than government facilities, which had an average score of 92%. Weighing scales for newborn babies were available in virtually all hospitals in both public and private facilities, and over 99% of health centres and other facilities were in both public and private facilities. Over 93% of all facilities in public facilities applied tetracycline eye ointment to both eyes, and 87% of all private facilities had tetracycline eye ointment applied to both eyes for the newborn babies. In Private facilities, Injectable oxytocin was observed in over 95%, and in about 95% of public facilities, oxytocin was observed. While routine application of cord traction during the 3rd stage of labour occurred in over 98% of all private facilities and 96% in public facilities. Blood pressure was routinely reduced in 84% of public facilities and 98% in private facilities. Partograph use was observed in 98% of public facilities and 98% in private facilities. Newborn babies were dried and wrapped to keep them warm I almost all facilities and about 98% for public facilities and 99% for private facilities delivered the newborn to the abdomen routinely. Massage of the Uterus after delivery was observed in 89% of private facilities and only 78% in public facilities. About 75% of private facilities had soap and running water or hand disinfectants while public facilities only 71% had soap and running water or hand disinfectants. The information is represented graphically as shown in Figure 2.
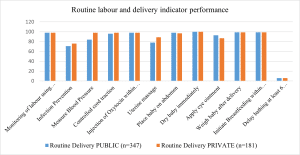
Figure 2: Performance distribution of routine delivery care services in facilities
Emergency obstetric care indicators: On indicators of emergency obstetric care, both public and private facilities performed poorly. However, public facilities did at least as well with an average score of 79%, and only 75% of private facilities. Only about 9% of public facilities reported being able to provide blood transfusions, and 29% of private facilities. While about 9% of public facilities were able to provide sterile C-section or instrument-assisted deliveries, and 9% as well for private facilities. In about 73% of public facilities and only 63% of private facilities, there was an extraction of retained placenta products in the last 3 months. About 54% of public facilities reported that they had the ability to extract retained products of conception, and 46% of private facilities. Injectable magnesium sulfate and Injectable diazepam were observed in 93% of public facilities, and only 85% of private facilities had injectable magnesium sulfate and diazepam to control eclamptic convulsions. Parenteral antibiotic use was observed in 88% of public facilities and 90% of private facilities. This information is in table form and graphically presented in Figure 3.
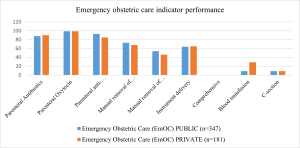
Figure 3: Performance distributions of emergency obstetric care indicators
Emergency neonatal care indicators: In 94% of public facilities were observed to have the capacity to do infant resuscitation with a bag and masks. However, about 91% of private facilities had the capacity to perform infant resuscitation. Injectable gentamicin for treatment of neonatal sepsis was observed in 94% of private facilities and 91% of public facilities. 55% of public facilities were able to perform Kangaroo mother care routinely for premature newborn babies, and 58 % for private facilities. Injectable dexamethasone for lung maturity in premature newborn babies was observed in 87% of private facilities and only 9% of public facilities. While intravenous infusion sets and fluids were observed in 69% of public facilities and 80% of private facilities. Neither private nor public facilities were observed doing routine expressed milk feeding to the newborn babies. On average, both public and private facilities did not do well in terms of emergency neonatal care indicators. However, public facilities performed better than private facilities, with a score of 61% against 59% for private facilities. Generally, private facilities performed better than public facilities in this indicator area. Figure 4 explains the above information.
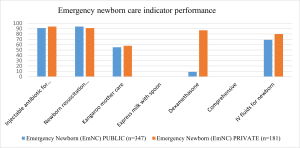
Figure 4: Performance distribution of emergency newborn care indicators
Antenatal care indicators: The majority of public and private facilities had iron tables and folic acid, and were able to provide for mothers. 40% of public facilities had iron tablet,s and 43% of private facilities. Almost 24% of private facilities had folic acid, and 16% of public facilities. Routine STI screening and treatment were observed in 36% of private facilities and 21% of public facilities. While HIV testing and treatment were observed in 97% of public facilities and 87% of private facilities. ANC was observed to be open for services on more than 5 days in a week, at 34% for public facilities and 54% for private facilities. Tetanus Toxoid vaccine was available on a daily basis at 83% of public facilities and 81% of private facilities. Urine tests for protein and glucose were observed to be routinely provided in 37% of private facilities and only 12% of public facilities. Blood pressure was observed routinely in 97% of private facilities and only 52% of public facilities. Hemoglobin check for anemia was observed to be routinely done in 60% of private facilities and 16% of public facilities. Guidelines and teaching aids for ANC were observed in 63% of public facilities and 50% in private facilities. At least 74% of public health facilities had their health care workers trained in ANC services, while 59.29% of private facilities had their health care staff trained in ANC services. Figure 5 below presents the information above.
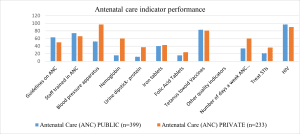
Figure 5: Performance distribution of antenatal care indicators
The average performance on quality indicators between private and public facilities had small differences, with public facilities performing better on some of the indicators while private facilities on others. In general, private facilities had higher scores on basic quality indicators of routine labour and delivery, emergency newborn care, and antenatal care, with an average score of 94%, 83%, and 57%, respectively, against 92%, 50%, and 44% for public facilities. While public health facilities performed better on emergency obstetric care indicators, with a score of 79% against 76% for private health facilities.
Perceived quality: More complaints were noted about public facilities. The most common reported complaint was long waiting time for a provider or ANC visit, where 19% of women in public facilities raised this complaint, and 13.1% of the women in private facilities. The most noted complaint was that facilities were being opened for a limited number of hours, of which 9% of women raised this complaint in both public and private facilities. The next complaint was the availability of medication, with a score of 7% of women in public facilities and 5% of women in private facilities. 4% of women in public facilities and 2% of women in private facilities raised complaints about providers not being able to discuss their problems during consultations. Nearly 10% of women in private facilities also complained of cost of services. Generally, more complaints were reported in public facilities than in private facilities. The most common complaints raised by women in both public and private facilities are a long wait for a provider or an ANC visit, seconded by facilities being open for limited hours. The third most complained about was the cost of services in private facilities, while in public facilities, it was the lack of medicine in health facilities. The rest had a score of less than 5% of women in complaints. This information has been presented graphically in Figure 6 below.
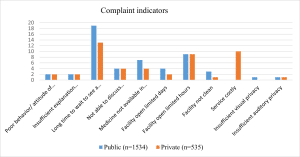
Figure 6: Percentage of ANC clients that reported each type of complaint by facility managing authority
Factors associated with high complaint score: The average facility-level complaint score was the principal outcome of the first analysis. A higher score indicates that outgoing ANC patrons filed more complaints on average. Clients leaving private ANC facilities had statistically insignificant lower complaint scores than those leaving public facilities, with a difference of -0.25. There were substantially higher complaints when ANC was given in a hospital rather than at health centre or a c clinic (p<0.05). It was also clear from the results above that asking if they had any questions by a provider was linked to clients having fewer overall complaints. More than 5 days of ANC each week were related to considerably more complaints (p<0.05). There was no discernible trend in terms of services provided for any of the variables. Hemoglobin testing and consistently checking blood pressure were both linked to a higher complaint score. Finally, treating STIs was linked to a higher score on the complaint scale. Other factors, such as ANC training materials, tetanus availability, and blood pressure services, were not found to be significantly linked to complaint scores. This has been presented in table form in table 3 below.
| Complaint predicting factor | Private | Public |
| Private compared to the public facility | -0.25 | 0.15 |
| Facility category (Hospital to Hc+ clinics) | 0.15 | 1.12** |
| Percent asked if patients had questions | -0.14 | 0.17** |
| ANC offered 5+ days a week | 0.21 | 0.30** |
| Has training materials for ANC | -0.31 | 0.2 |
| Tetanus available today | 0.04 | 0.28 |
| Offers urine tests, routinely observed | -0.15 | 0.21** |
| Blood test for anemia (Hb) routine, observed | 0.45 | 0.14** |
| Offers BP, routine, observed | -0.23 | 0.3 |
| Treats STIs | 0.26 | 3.30** |
| Constant | 1.85 | 0.44** |
Table 3: Multivariable regression of predictors of average facility level complaint score reported by patients exiting ANC centers by each facility type, coefficient (Robust standard error)
Factors associated with higher care scores: Generally, small differences appeared between private and public facilities at every indicator in our analysis. We formulated a performance score for each indicator area, which includes routine labour and delivery Care, EmOC, EmNC, and ANC. We did regression on facility types such as hospital, health center, maternity, and clinic, and private against public on every indicator score area. Public facilities scored significantly higher in EmOC and EmNC scores (p<0.1) while private facilities on ANC and marginally on routine labour and delivery (p<0.05). Being in a lower-level facility was associated with lower scores for every topic, compared to hospitals, except for ANC for private facilities, where lower-level facilities had higher scores. Maternity and clinic types of facilities were associated with lower scores on all indicators than health centers and hospitals. The information has been presented in table form in Table 4 below.
| Routine delivery | EmOC | EmNC | ANC | |
| Private to Public facilities | 0.05 (0.14) | 0.49 (0.6)*** | 0.12 (0.05)*** | −0.08 (0.09) |
| Hospitals | −1.57 (0.17)*** | −1.92 (0.08)*** | −0.74 (0.08)*** | −0.16 (0.12) |
| Health Centre | −5.62 (0.13)*** | −2.90 (0.07)*** | −2.51 (0.07)*** | −1.38 (0.10)*** |
| Maternity | −1.25 (0.28)*** | −2.47 (0.08)*** | −0.26 (0.17) | 0.68 (0.23)*** |
| Clinic | −2.80 (0.25)*** | −3.01 (0.07)*** | −1.35 (0.15)*** | 0.75 (0.20)*** |
*< 0.1, **< 0.05, ***< 0.01
Table 4: Multivariable regression of types of facility (public/private), level of facility (hospital, health center, maternity and clinic), and score of routine care indicators (routine delivery, EmOC, EmNC, ANC)
Discussion
In this study, we assess the quality of basic maternal, antenatal, and neonatal care signal functions using large, nationally representative data from the DHS and the MSPA data. We tested the relationship between facility-level quality indicators and patients’ experiences of quality for ANC services. In both arms of the facility management authority type, we found that more health facilities for maternity delivery were not adequately prepared to provide good-quality emergency obstetric care and emergency neonatal care. We have also observed that both private and public facilities were doing well on routine labour and delivery and antenatal care services. In Malawi, most women deliver or seek maternal or neonatal care services in public health facilities. This means that many women and their newborn babies are exposed to substandard care, resulting in an increase in maternal and neonatal morbidity and mortality rates. Currently, our country is experiencing this despite an increasing number of women delivering in health facilities.
Despite many indicators being similar between public and private health facilities, there were some significant differences in routine labour and delivery, EmOC, EmNC, and ANC. Private owned facilities scored well on routine labour and delivery and antenatal care, while public facilities did well on emergency obstetric care and emergency neonatal care. The possible explanations for these significant differences between private facilities and public facilities may include the availability of resources (perhaps due to patient fees or charitable funding sources), the availability of well-trained staff and some with specialist training, the availability of adequate working staff, the availability of good managers and administrators, etc.
In this study, we also explored that the perception of patients towards quality service provision at a facility through ANC exit interviews was not consistently associated with any of the measures of quality. Each facility ownership type had its own indicator area where it performed better than the other arm of the facility ownership type. Public facilities performed better in the quality-of-care indicator area of routine labour and delivery and ANC, while public facilities did well in the quality-of-care indicator area of emergency obstetric care and emergency neonatal care. Overall, most public facilities performed better than private facilities. However, Public health facilities had higher complaint scores than private facilities.
In some literatures also states that lower-level health facilities are associated with fewer complaints than the higher-level health facilities in both private and public health facilities. This has been linked to more time spent with clients by health providers and reduced time waiting for the services by clients for lower-level health facilities, hence they are referred to as patient-centered facilities. Some researchers have argued that higher level facilities providers have short time to spend with clients because of an increased number of clients in need of services with inadequate resources such as human resources, material resources and infrastructure resources which has resulted in having an increased in complaint score than lower-level facilities in both managing authorities (private and public).[23,24]
Other researchers have argued that differences in complaint scores between public and private facilities are due to the cost of services that are offered by the private and public facilities. Public facilities and their services are offered almost free. Almost all their services at private facilities are chargeable at a price that most women cannot afford. Therefore, with the high cost of services in private facilities, few women go for the services, have shorter time to wait for the services, providers have longer time to discuss problems experienced by their clients, and availability of resources, including medicine, private facilities have been observed reporting few complaints from women attending ANC services. However, it is important to note that despite people’s perceptions of quality being better at private facilities, there was no significant association between the type of facility (private/public) and the ANC quality score.
In other studies, a few complaints by clients through exiting ANC interviews have been linked to more time interactions with clients by health providers and a good client-provider relationship. This has also been supported by other literature, which states that women’s perception of the quality of services at a facility depends on their previous interaction with health providers of services at that facility.[23,24]
Recent studies have also linked patient perceptions of good quality of health services at a facility to the provision of good medical care services at the outpatient department. However, it is possible that these measures are not the right indicators to assess the quality of health services at a facility that has a greater impact on patient perceptions or a greater influence on patient perceptions.[25]
Currently, there is a global concern about mistreatment that women experience in health facilities at the time of their childbirth and during other reproductive health services. Studies have shown that more women have reported being disrespected and abused while seeking services for maternal and reproductive health care. Some examples of disrespect and abuse scenarios women experience during their maternal and reproductive health care services include a lack of privacy, disrespect, physical abuse, and being asked to pay in situations where the services are supposed to be free, especially in public facilities. This study analysis, therefore, recognizes this as an issue in the delivery of health care services, including maternal and neonatal care services. It also highlights points on poor quality of health care services and the impact that may have on service delivery, service utilization, and goal achievement on the reduction of maternal and neonatal morbidity and mortality.[26,27]
Recommendations: In general, the availability of basic quality of care functions or standards for maternal and neonatal care in health service delivery is doing well in the country, but remains below target levels according to WHO set targets for availability of infrastructure, health workforce, inpatient bed capacity, and health provider caseload. The high provider caseload that the country experiences in health care delivery, especially in public health facilities, directly affects the quality of healthcare service delivery, especially in maternal and neonatal services. Therefore, it is important for the government to prioritize material resources, medicine, equipment, human resources, and infrastructure support in all public health facilities at all levels to improve the quality of healthcare service in all public health facilities and at all levels of health care service delivery in the country.
Professional conduct should be strengthened among health providers, especially when communicating with women and their families in response to their healthcare needs and healthcare preferences. Effective communication is an essential component in addressing issues concerning clients’ and patients’ perceptions and experiences of the quality of health care received at a healthcare facility. Let all patients receive all the information about their illness and healthcare being given or prescribed for them, and let them be involved in all decisions regarding their treatment and care. Effective communication between healthcare providers and patients may reduce unnecessary anxiety and promote a good experience with healthcare service delivery at a facility.
Limitations: The study had some limitations. The SPA data were collected in 2013-2014, and there could be some changes in the status of maternal and neonatal health service delivery and the distribution and availability of resources currently. There could be misclassification of some health facilities as private health facilities, especially some NGOs and faith-based health facilities, while being partially or totally supported by the government. The SPA data did not include all the basic quality signal functions indicators for maternal and neonatal care, as suggested by past literature, and therefore, we were unable to replicate the scoring system used by other authors exactly. In addition, we may not be able to compare our findings directly to those of other papers. This is especially true for the EmNC indicators, where we could only get five out of six indicators according to Nesbitt et al.’s basic quality signal functions of maternal and neonatal assessment dimensions. Our findings on patients’ experiences through ANC exit interviews were also limited, and we are not sure if these measures are representative of all people’s experiences. We therefore suggest that more in-depth research is needed to capture appropriate indicators to bring the best understanding of what care women receive during their pregnancies and the delivery of their babies. Despite encountering a number of these limitations, our study builds upon current literature in several ways. It has applied the existing measurement tools for basic quality of care signal functions indicators for maternal and neonatal care service assessment of facilities, as proposed by Nesbitt et al.[22]This study has allowed us to compare privately owned facilities and government-owned ones on the availability of basic quality of care signal functions for maternal and neonatal care using a dataset that is both large and nationally representative. Random sampling was used in the collection of this data, so the findings should be more generalized. In this study, we also looked at the association between the client’s or patients’ perceptions of their experiences regarding the quality of care received at a facility and the availability of basic quality of care signal functions at a facility.
Conclusion
Globally more and more women seek their maternal and reproductive health care services in health facilities in response to a global campaign for health facility maternity and reproductive health care to reduce and control maternal and neonatal morbidity and mortality. However, an increase in the number of facility deliveries has not matched with a reduction or control of maternal and neonatal morbidity and mortality rates. Malawi is one of the sub-Saharan countries with high maternal and neonatal mortality rates and is struggling to find means to reduce and control them to meet the set global target by 2030. Many researchers have highlighted this problem of the lack of quality of health care services women receive in many health care facilities in search of their maternity or reproductive needs. In Malawi, a majority of both private and public health facilities lack many basic emergency and essential services in maternal and neonatal care. Those health facilities with all the recommended basic quality indicators of maternal and neonatal care services to improve maternal and neonatal health outcomes are either expensive for all women to access the services, or the demand for the services by women is overwhelming for those health facilities. An increasing rate of facility deliveries gives health care authorities and health care providers a chance to improve maternal and neonatal survival in the country. Quality Improvement projects and quality assurance projects in all health facilities should be an emphasis and priority to make use of this opportunity to improve maternal and neonatal survival in the country. As the quality of care assumes a more prominent role in national and global efforts to improve population health outcomes, accurate measurement is vital. Healthcare providers and physical inputs, such as buildings, medicines, and equipment, are an essential foundation for quality healthcare service delivery in the country. In general, expanding measurement of processes and outcomes of health care is imperative in the achievement of better health outcomes and improvement of performance of health systems in the country.
References
- UN Development Program. Sustainable development goals. 2015. Sustainable development goals
- Kassebaum NJ, Bertozzi-Villa A, Coggeshall MS, et al. Global, regional, and national levels and causes of maternal mortality during 1990-2013: a systematic analysis for the Global Burden of Disease Study 2013. Lancet. 2014;384(9947):980-1004. doi:10.1016/S0140-6736(14)60696-6 PubMed | Crossref | Google Scholar
- Victora CG, Requejo JH, Barros AJ, et al. Countdown to 2015: a decade of tracking progress for maternal, newborn, and child survival: 1998. Lancet. 2016;387(10032):2049-2059. doi:10.1016/S0140-6736(15)00519-X
PubMed | Crossref | Google Scholar - Alkema L, Chou D, Hogan D, et al. Global, regional, and national levels and trends in maternal mortality between 1990 and 2015, with scenario-based projections to 2030: a systematic analysis by the UN Maternal Mortality Estimation Inter-Agency Group. Lancet. 2016;387(10017):462-474. doi:10.1016/S0140-6736(15)00838-7
PubMed | Crossref | Google Scholar - Ronsmans C, Graham WJ; on behalf of The Lancet Maternal Survival Series Steering Group. Maternal mortality: who, when, where, and why. Lancet. 2006;368(9542):1189-1200. doi:10.1016/S0140-6736(06)69380-X
PubMed | Crossref | Google Scholar - United Nations Inter-Agency Group for Child Mortality Estimation (UN IGME). Levels & trends in child mortality: Report 2015. Levels & trends in child mortality
- National Statistical Office. Malawi Demographic and Health Survey 2015-16. 2017. Malawi Demographic and Health Survey 2015-16
- United Nations Population Fund. Trends in maternal mortality: 1990 to 2015: Estimates by WHO, UNICEF, UNFPA, World Bank Group, and the United Nations Population Division. 2015. Trends in maternal mortality: 1990 to 2015
- Bullough C, Meda N, Makowiecka K, Ronsmans C, Achadi EL, Hussein J. Current strategies for the reduction of maternal mortality. BJOG. 2005;112(9):1180-1188. doi:10.1111/j.1471-0528.2005.00718.x PubMed | Crossref | Google Scholar
- Doctor HV, Nkhana-Salimu S, Abdulsalam-Anibilowo M. Health facility delivery in sub-Saharan Africa: successes, challenges, and implications for the 2030 development agenda. BMC Public Health. 2018;18(1):765. doi:10.1186/s12889-018-5695-z PubMed | Crossref | Google Scholar
- Kongnyuy EJ, van den Broek N. The difficulties of conducting maternal death reviews in Malawi. BMC Pregnancy Childbirth. 2008;8:42. doi:10.1186/1471-2393-8-42 PubMed | Crossref | Google Scholar
- van den Broek NR, Graham WJ. Quality of care for maternal and newborn health: the neglected agenda. BJOG. 2009;116 Suppl 1:18-21. doi:10.1111/j.1471-0528.2009.02333.x PubMed | Crossref | Google Scholar
- Yanful B, Kirubarajan A, Bhatia D, et al. Quality of care in the context of universal health coverage: a scoping review. Health Res Policy Syst. 2023;21(1):21. doi:10.1186/s12961-022-00957-5 PubMed | Crossref | Google Scholar
- Admasu K, Haile-Mariam A, Bailey P. Indicators for availability, utilization, and quality of emergency obstetric care in Ethiopia, 2008. Int J Gynaecol Obstet. 2011;115(1):101-105. doi:10.1016/j.ijgo.2011.07.010 PubMed | Crossref | Google Scholar
- Tripathi V, Stanton C, Strobino D, Bartlett L. Development and validation of an index to measure the quality of facility-based labor and delivery care processes in sub-Saharan Africa. PLoS One. 2015;10(6):e0129491. doi:10.1371/journal.pone.0129491 PubMed | Crossref | Google Scholar
- World Health Organization. Monitoring Emergency Obstetric Care. A Handbook. 2009. Monitoring Emergency Obstetric Care
- Gabrysch S, Civitelli G, Edmond KM, et al. New signal functions to measure the ability of health facilities to provide routine and emergency newborn care. PLoS Med. 2012;9(11):e1001340. doi:10.1371/journal.pmed.1001340
PubMed | Crossref | Google Scholar - Gabrysch S, Civitelli G, Edmond KM, et al. New signal functions to measure the ability of health facilities to provide routine and emergency newborn care. PLoS Med. 2012;9(11):e1001340. doi:10.1371/journal.pmed1001340
PubMed | Crossref | Google Scholar - Tunçalp Ӧ, Were WM, MacLennan C, et al. Quality of care for pregnant women and newborns—the WHO vision. BJOG. 2015;122(8):1045-1049. doi:10.1111/1471-0528.13451 PubMed | Crossref | Google Scholar
- van Eijk AM, Bles HM, Odhiambo F, et al. Use of antenatal services and delivery care among women in rural western Kenya: a community-based survey. Reprod Health. 2006;3:2. doi:10.1186/1742-4755-3-2
PubMed | Crossref | Google Scholar - Blanc AK, Warren C, McCarthy KJ, Kimani J, Ndwiga C, RamaRao S. Assessing the validity of indicators of the quality of maternal and newborn health care in Kenya. J Glob Health. 2016;6(1):010405. doi:10.7189/jogh.06.010405
PubMed | Crossref | Google Scholar - Nesbitt RC, Lohela TJ, Manu A, et al. Quality along the continuum: a health facility assessment of intrapartum and postnatal care in Ghana. PLoS One. 2013;8(11):e81089. doi:10.1371/journal.pone.0081089
PubMed | Crossref | Google Scholar - Kruk ME, Paczkowski M, Mbaruku G, de Pinho H, Galea S. Women’s preferences for place of delivery in rural Tanzania: a population-based discrete choice experiment. Am J Public Health. 2009;99(9):1666-1672. doi:10.2105/AJPH.2008.146209 PubMed | Crossref | Google Scholar
- Yakong VN, Rush KL, Bassett-Smith J, Bottorff JL, Robinson C. Women’s experiences of seeking reproductive health care in rural Ghana: challenges for maternal health service utilization. J Adv Nurs. 2010;66(11):2431-2441. doi:10.1111/j.1365-2648.2010.05404.x PubMed | Crossref | Google Scholar
- Das J, Holla A, Das V, Mohanan M, Tabak D, Chan B. In urban and rural India, a standardized patient study showed low levels of provider training and huge quality gaps. Health Aff (Millwood). 2012;31(12):2774-2784. doi:10.1377/hlthaff.2011.1356 PubMed | Crossref | Google Scholar
- Bohren MA, Vogel JP, Hunter EC, et al. The mistreatment of women during childbirth in health facilities globally: a mixed-methods systematic review. PLoS Med. 2015;12(6):e1001847. doi:10.1371/journal.pmed.1001847
PubMed | Crossref | Google Scholar - Abuya T, Warren CE, Miller N, et al. Exploring the prevalence of disrespect and abuse during childbirth in Kenya. PLoS One. 2015;10(4):e0123606. doi:10.1371/journal.pone.012360 PubMed | Crossref | Google Scholar
Acknowledgments
The author would like to thank Prof. William Stones, my academic Supervisor, and Dr. Fatsani Ngwalangwa for providing scientific expertise. My acknowledgments would be incomplete without the mention of my dear wife, Agathar Mwinjiro Manda, and my children, Ntchindi junior, Victor, and Brian, who have always been by my side. Finally, I thank my God Almighsustainedrcies that has sustained me throughout the time I was doing the research.
Funding
Not applicable
Author Information
Corresponding Author:
Eddie V.N. Manda
Department of Public Health
Kamuzu University of Health Science, Malawi
Email: [email protected]
Co-Author:
William Stones
Department of Public Health
Blantyre District Health Office, Malawi
Authors Contributions
All authors contributed to the conceptualization, investigation, and data curation by acquiring and critically reviewing the selected articles. They were collectively involved in the writing – original draft preparation, and writing – review & editing to refine the manuscript. Additionally, all authors participated in the supervision of the work, ensuring accuracy and completeness. The final manuscript was approved by all named authors for submission to the journal.
Ethical Approval
The Kamuzu University of Health Sciences, COMREC, approved the study. This is a review board of the Kamuzu University of Health Sciences, college of medicine. Since de-identified secondary data was used, the need for participant consent was waived by the Kamuzu University of Health Sciences, college of medicine research ethics committee. Permissions to access data were sought from the DHS.
Conflict of Interest Statement
Not applicable
Guarantor
None
DOI
Cite this Article
Eddie VNM, William S. Quality of Basic Maternal and Neonatal Care Signal Function and Clients’ Perceived Care in Health Facilities in Malawi: An Analysis of the National Health Services Survey Using 2013-2014 Malawi SPA Survey Data. medtigo J Med. 2024;2(4):e30622467. doi:10.63096/medtigo30622467 Crossref