


 Author Affiliations
Abstract
Background: Intellectual disability (ID) and attention deficit hyperactivity disorder (ADHD) are common neurodevelopmental disorders in childhood and may coexist, resulting in significant cognitive, behavioral, and functional impairment. Identifying associated factors is essential for early recognition and intervention.
Methodology: This prospective cross-sectional study was conducted at the Children’s Hospital of Nanjing Medical University, China, from May 2023 to December 2024. A total of 148 children aged 4–10 years were enrolled. Cognitive function was assessed using the Wechsler Intelligence Scale for Children–Revised (WISC-R). ADHD symptoms and functional impairment were evaluated using the Swanson, Nolan, and Pelham Rating Scale – Fourth Version (SNAP-IV), Conners Parent Rating Scale (CPRS), and Weiss Functional Impairment Rating Scale–Parent (WFIRS-P). Sociodemographic, prenatal, perinatal, and caregiver-related variables were extracted from electronic medical records. Multivariate logistic regression analyses were performed to identify factors independently associated with ID and ADHD.
Results: Intellectual disability or borderline cognitive functioning was identified in approximately 24% of participants, while 29.3% met diagnostic criteria for ADHD. Independent factors associated with ID included younger age, larger head circumference, history of allergic disease, and lower caregiver education level, whereas higher caregiver education was protective. ADHD was independently associated with older age, lower maternal pre-pregnancy weight, umbilical cord complications during pregnancy, and democratic or neglectful parenting styles.
Conclusion: ID and ADHD in children aged 4–10 years are influenced by multiple biological, prenatal, and caregiver-related factors. These findings support early integrated screening, caregiver education, and optimization of maternal and perinatal health to improve neurodevelopmental outcomes.
Keywords
Intelligence quotient, Intellectual Disability, Children, Attention-deficit/hyperactivity disorders, Risk factors.
Introduction
Intellectual disability (ID) and ADHD are two of the most diagnosed developmental disorders in children worldwide. These conditions significantly affect a child’s cognitive, emotional, and psychosocial development, leading to long-term consequences that can interfere with academic achievement, social integration, and overall well-being.[1,2]
Intellectual functioning is often assessed using the intellectual quotient (IQ), which categorizes children into three levels: normal (IQ>80), marginal (IQ: 70-79), and developmental (IQ below 70).[3] Each category presents unique challenges. Children with normal IQs may face academic and social difficulties due to ADHD, which can hinder their overall development.[4] Conversely, those classified as marginal or developmental ID encounter more severe cognitive limitations, leading to increased behavioral problems and social integration challenges.[5] Studies have shown that children with ID are at a higher risk for developing comorbid conditions, including ADHD, which complicates their educational and social experiences.[6]
ID is characterized by significant limitations in intellectual functioning, typically measured by an IQ of 70 or below, and deficits in adaptive behavior that affect a child’s ability to function in daily life.[7] These impairments in intellectual and adaptive skills can profoundly affect a child’s academic performance, social interactions, and overall life outcomes.[8] ID can be classified into varying degrees of severity, ranging from mild to profound, and is often associated with other medical or psychological conditions, such as autism spectrum disorder (ASD) or physical disabilities, which can further complicate the developmental trajectory.[7]
Developmental milestones in children with ID are often delayed, particularly in motor skills, cognitive abilities, and language development.[9] Delays in motor development are common, ranging from difficulties with fine motor skills to those with gross motor skills [9]. Cognitive delays are also prominent, often resulting in slower learning rates and difficulties with abstract thinking or problem-solving.[9] Speech and language delays further compound the challenges faced by individuals with ID, as communication is critical to social interaction and daily functioning.[9] In addition to developmental delays, individuals with ID may exhibit other physical and neurological features. These can include conditions such as microcephaly, dysmorphic features, and epilepsy, particularly in cases with more severe cognitive impairments.[10] Motor disabilities such as spasticity and coordination challenges are also more common in individuals with moderate to severe ID.[8] Furthermore, co-occurring conditions such as ASD and ADHD are frequently seen in individuals with ID, adding complexity to both the clinical presentation and the management of these individuals.[11]
ADHD, on the other hand, is a neurodevelopmental disorder defined by persistent patterns of inattention, hyperactivity, and impulsiveness that significantly impair a child’s ability to function effectively in academic and social environments.[12]
The core symptoms of ADHD are categorized into two broad domains: inattention and hyperactivity-impulsivity.[13] Inattention involves difficulties in sustaining focus, following instructions, organizing tasks, and avoiding careless mistakes. Individuals with inattention may often appear forgetful, disorganized, or easily distracted.[13] Hyperactivity, on the other hand, includes excessive fidgeting, restlessness, difficulty remaining seated, and a constant need to be in motion.[13] Impulsivity manifests as acting without thinking, interrupting others, difficulty waiting one’s turn, or making hasty decisions.[13] These symptoms must be present for at least six months and result in significant impairment in at least two areas of the individual’s life, such as academic performance, social relationships, and daily activities.
The clinical presentation of ADHD can vary widely between individuals. In some cases, symptoms are predominantly inattentive; in others, hyperactivity-impulsivity is more prominent. Additionally, there is a subtype of ADHD known as Combined Presentation, in which both inattention and hyperactivity-impulsivity are equally evident.[13] It is important to note that the severity of the disorder varies, with some individuals experiencing mild, manageable symptoms. In contrast, others face more significant challenges that require intensive intervention and support.
Moreover, co-occurring conditions are common in individuals with ADHD, including oppositional defiant disorder (ODD), conduct disorder, anxiety, depression, and substance use disorders.[6] These comorbidities can complicate the clinical picture and necessitate a comprehensive evaluation to guide treatment planning.
Furthermore, neurobiological underpinnings, ADHD is thought to involve dysregulation of certain brain regions, particularly those involved in attention, impulse control, and executive functioning.[14] Structural and functional neuroimaging studies have shown abnormalities in regions including the prefrontal cortex, basal ganglia, and cerebellum, all of which are integral to the regulation of behavior and cognition.[15] Neurotransmitters like dopamine and norepinephrine also play a crucial role in ADHD, and medications that target these pathways, such as stimulants, are commonly used in treatment to improve attention and reduce impulsivity.[16]
Children with ADHD often struggle with maintaining focus, controlling impulses, and following instructions, leading to challenges in school and social settings. Hence, the relationship between these two conditions and their impact on childhood development has garnered increasing attention in clinical and research settings.
The global prevalence of ADHD is estimated to be around 5-7% of children, with variations depending on cultural and diagnostic criteria.[17] In contrast, ID affects approximately 1-3% of the global population, with higher prevalence rates in developing countries due to factors such as inadequate access to healthcare, prenatal care, and early childhood nutrition.[18-20] Both ID and ADHD pose significant challenges not only to the affected children but also to their families and the healthcare systems in place to provide necessary support and interventions. Early identification and intervention are crucial to improving outcomes for children with these conditions. Still, barriers such as a lack of trained professionals, societal stigma, and insufficient resources often hinder access to timely care.[21,22]
Research has shown that the co-occurrence of ID and ADHD in children is not uncommon. Studies suggest that up to 30-50% of children with ID also exhibit symptoms of ADHD, complicating the clinical picture and treatment approaches.[6] This dual diagnosis presents unique challenges for clinicians, such as the overlapping symptoms of inattention, impulsiveness, and developmental delays, which can make accurate diagnosis and intervention more difficult. Furthermore, the presence of both conditions often results in more severe developmental delays and a greater need for specialized educational and psychological interventions.[23]
The prevalence of ADHD in Chinese children is similarly significant, with studies indicating that ADHD affects about 6-8% of the child population in China.[24] Both conditions have profound implications not only for the individuals diagnosed but also for their families and the broader healthcare and educational systems.[25] The societal and economic costs of supporting individuals with ID and ADHD, in terms of healthcare services, educational interventions, and social support, are considerable. Furthermore, the stigma surrounding these conditions, particularly in some Chinese communities, can exacerbate the difficulties faced by affected children and their families, often resulting in delayed diagnoses and inadequate support.
The burden of these neurodevelopmental disorders is compounded by the rapid societal changes in China, including urbanization, changing family structures, and the pressures of a competitive education system. These factors can influence both the development and recognition of intellectual disability and ADHD in children.
Moreover, the factors contributing to the high prevalence of these conditions in China, such as genetics, environmental influences, socio-economic status, access to healthcare, and cultural attitudes toward mental health, remain inadequately explored.[25]
Despite a growing body of research on ADHD and intellectual disability globally, there is a need for more focused studies examining the specific factors contributing to these conditions within the Chinese context. The complexity of these disorders, coupled with diverse genetic, environmental, and socio-cultural factors, necessitates a multivariate approach to understand the key influences on their development. This study aims to address this gap by examining the influencing factors associated with intellectual disability and ADHD in children aged 4-10 years in a Chinese population. Using multivariate analysis, this research will examine the interrelationships among sociodemographic, environmental, and healthcare-related factors, providing valuable insights into the prevalence and risk factors of these disorders.
Methodology
Study design and setting of the study: This cross-sectional study was conducted at the Department of Rehabilitation at the Children’s Hospital of Nanjing Medical University. Before the study’s initiation, ethical approval was obtained from the Institutional Review Board of Nanjing Medical University, ensuring compliance with all ethical guidelines and standards for research involving human subjects. The study enrolled 148 participants; all recruited between May 2023 and December 2024. Before enrolment, informed consent was obtained from all participants or their legal guardians. This process involved providing detailed information about the study’s purpose, procedures, potential risks, and benefits, allowing participants to make an informed decision regarding their involvement.
Participants’ selection: One hundred and forty participants were selected based on predefined inclusion criteria, ensuring that they met the study’s demographic and clinical characteristics. The inclusion criteria required that participants have children aged 4 to 10 years, regardless of their own IQ or ADHD status. Exclusion criteria were notable neurological conditions or disability, and chronic illnesses, including cardiac, pulmonary, or renal disorders.
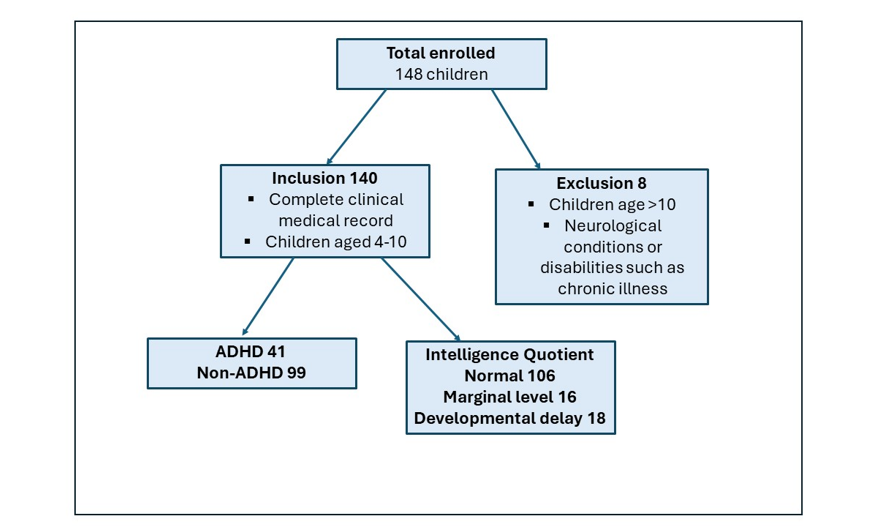
Figure 1: Flow chart for the study participants’ selection
Data collection: The children were selected for this study through a comprehensive review of electronic medical records, which provided detailed documentation of various relevant health and demographic data. Participants were selected based on specific criteria encompassing child information, maternal history, family dynamics, and behavioral assessments.
Child-related data were systematically compiled, focusing on demographic characteristics such as age, gestational age at birth, and birth weight. Additionally, the medical and family history included information on perinatal infections, neonatal intracranial hemorrhage, birth asphyxia, and neonatal hyperbilirubinemia. Maternal data collected encompassed various aspects of maternal health and socioeconomic background, including maternal age; height and weight before pregnancy; mode of delivery; mode of conception; number of previous births; and specific pregnancy details such as amniotic fluid status, umbilical cord status, and placental health. The presence of maternal health conditions such as gestational diabetes mellitus, hypertension, hypothyroidism, anemia, infections during pregnancy, and allergic diseases was also recorded. Furthermore, lifestyle factors like the maternal emotional state, adverse life experiences during pregnancy, sleep duration, and nutritional supplementation were considered.
Participants’ family dynamics were also considered, as additional data included the family environment and history of behavioral disorders. These encompassed instances of ADHD or related issues within the family, as well as the literacy levels of foster caregivers, where relevant, along with general caregiving environments.
Physical examinations were conducted during medical visits to assess the children’s physical and developmental status and measure growth indicators such as weight, height, and head circumference.
Behavioral and intelligence assessments were performed using a variety of standardized instruments.
- WISC-R was administered to assess the children’s cognitive abilities. This standardized test, suitable for children aged 6-16, evaluates various aspects of intelligence through multiple subtests. The subtests are categorized into Verbal (vocabulary, comprehension) and Non-Verbal (picture completion, block design) scales. The WISC-R yields an average score of 100, with lower scores indicating lower cognitive abilities.
- WFIRS-P assessed functional impairments. This standardized tool evaluates the impact of behavioral and mental health issues, such as ADHD, on daily functioning in children and adolescents. Completed by parents or caregivers, the WFIRS-P provides insight into how symptoms affect daily life across various domains.
- The SNAP-IV questionnaire was utilized to evaluate symptoms of ADHD. The SNAP-IV is a widely used, standardized assessment tool that measures the severity of ADHD symptoms in children. Completed by parents or teachers, the questionnaire assesses symptoms across two subscales:
- Inattention: Evaluates symptoms such as difficulty sustaining focus, following instructions, and completing tasks.
- Hyperactivity-Impulsivity: Assesses symptoms like fidgeting, restlessness, impulsivity, and difficulty waiting for one’s turn.
- CPRS was administered to assess a broad spectrum of behavioral problems in children. Parents complete this standardized, widely used assessment tool, which provides valuable insights into various aspects of a child’s behavior. Furthermore, the study collected data on children’s lifestyle factors, including time spent on electronic devices and daily sleep duration.
Statistical analysis: The statistical analysis was conducted in a structured sequence to comprehensively evaluate the factors associated with ID and ADHD in children aged 4-10. Descriptive statistics were first employed to summarize the dataset. Categorical variables were expressed as frequencies and percentages, with group comparisons performed using chi-square tests or Fisher’s exact test for small sample sizes. Continuous variables were reported as means ± standard deviations (SD) and compared across groups using independent Student’s t-tests for two categories or one-way ANOVA for three or more categories.
Intellectual quotient was categorized into three groups based on WISC-R scores: developmental delay (IQ < 70), marginal level (IQ 70–79), and normal (IQ ≥ 80). Bivariate analyses were then conducted to identify preliminary associations between individual exposure and outcomes (ID, ADHD). Continuous relationships were assessed using linear regression, while categorical outcomes were evaluated via unadjusted logistic regression. Variables demonstrating a significance level of p < 0.05 in these initial analyses were retained for further multivariable modelling to avoid premature exclusion of potential confounders.
Multivariate analyses were performed using a hierarchical approach. In the first model (unadjusted), univariate logistic regression was used to assess crude associations between predictors and outcomes. Variables achieving statistical significance (p < 0.05) were advanced to the second model (adjusted), which incorporated covariates. Adjusted odds ratios (aOR) with 95% confidence intervals (CI) were reported.
All statistical procedures were executed using IBM SPSS Statistics 25.0 (Armonk, NY, USA), and a significance threshold of p < 0.05 was applied throughout the study.
Results
Distribution of IQ levels among children: Figure 1 presents the distribution of IQ levels among the children assessed in this study, categorized into three groups: normal, marginal, and developmental delay. Most children, 106 (75.7%), fall within the normal IQ range, indicating that a significant portion of the population assessed demonstrates cognitive abilities that are typical for their age group. A smaller proportion, 16 (11.4%), is classified at the marginal level of IQ, suggesting a performance level that is below average but not classified as a developmental delay. Finally, 18 (12.9%) of the children have developmental delays, indicating challenges in cognitive functioning that may require specialized attention.
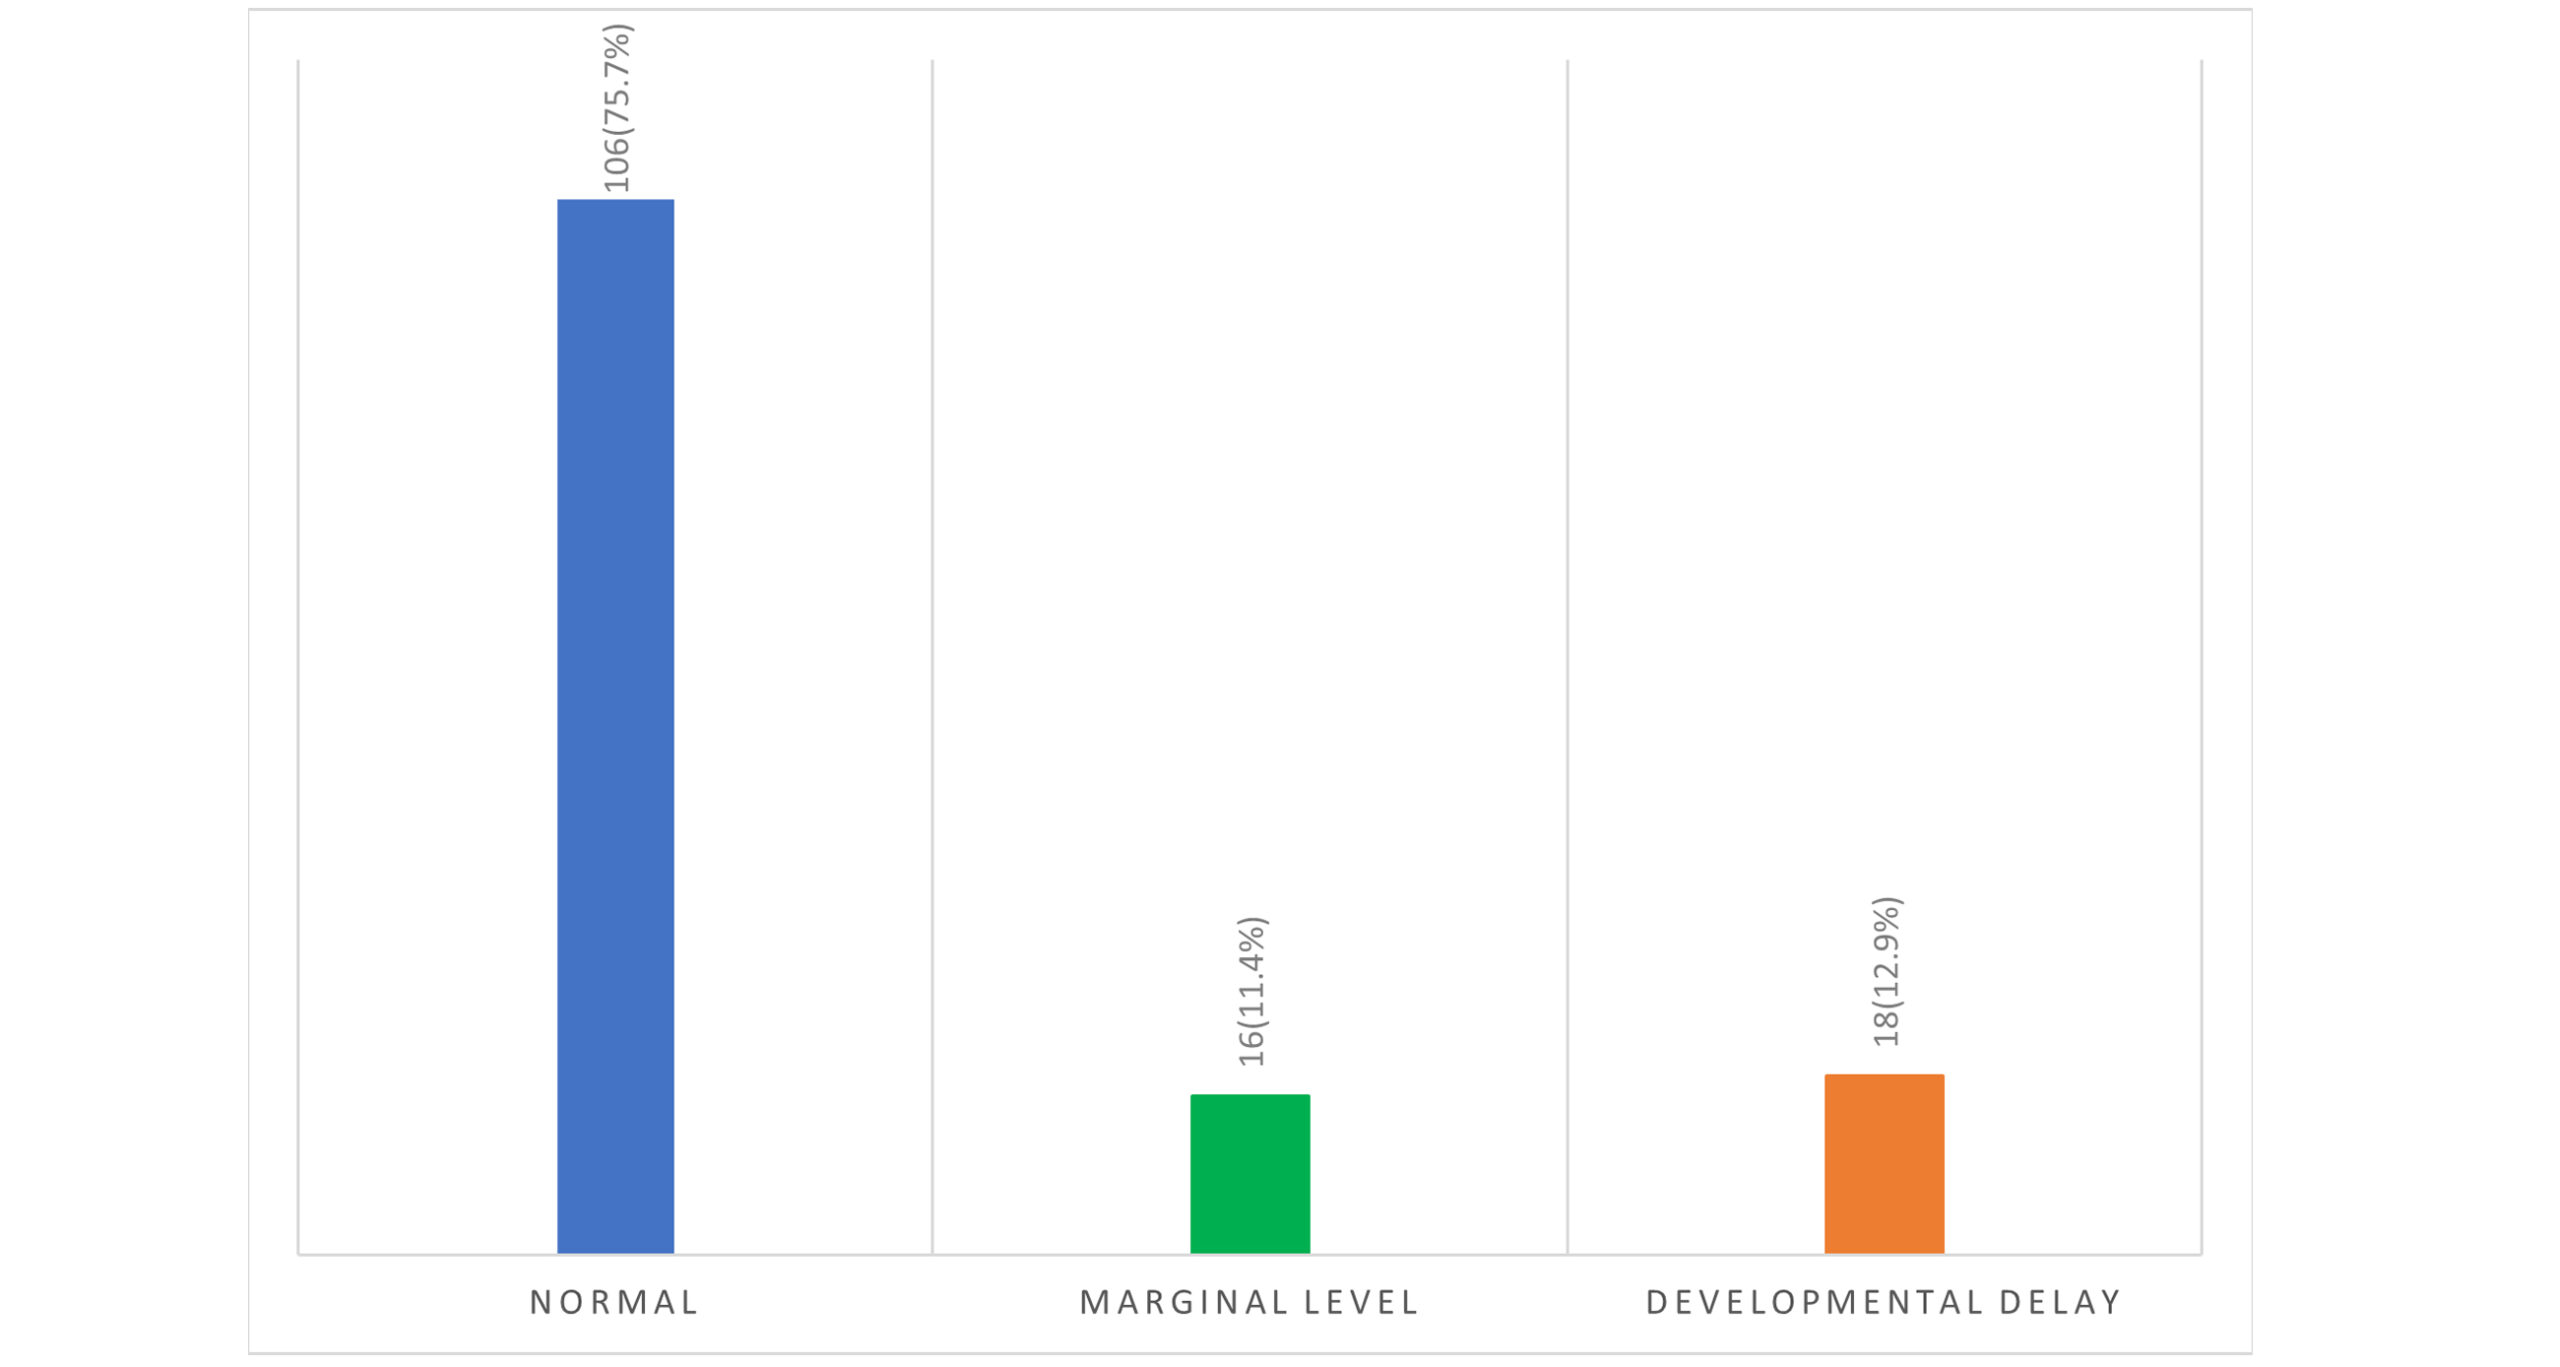
Figure 2: Distribution of IQ level among the children
Influencing factors associated with intellectual disabilities among children aged 4 to 10: Table 1 outlines the results of two regression models investigating factors influencing intellectual disabilities in children aged 4 to 10. In Model 1, several factors demonstrate significant associations with intellectual disabilities. The child’s age shows a coefficient of -0.018 (95% CI: -0.031 to -0.004) with a p-value of 0.010, indicating that as children age, the likelihood of intellectual disabilities decreases. This suggests an inverse relationship between age and cognitive impairment. The birth gestational age presents a positive association with a coefficient of 0.121 (95% CI: 0.007 to 0.235), with a p-value of 0.038, implying that lower gestational age is linked to increased intellectual disabilities. Head circumference is another significant factor, with a coefficient of 0.174 (95% CI: 0.044 to 0.304) and a p-value of 0.009. This suggests that a larger head circumference is associated with a higher likelihood of intellectual disabilities, possibly indicating underlying neurological issues.
The caregiver’s education level significantly affects the risk of intellectual disabilities; caregivers with a bachelor’s degree or higher have a coefficient of -2.707 (95% CI: 0.067 to 0.524, p = 0.010), indicating a reduced risk. Conversely, a middle school education or below does not show a significant impact, with a coefficient of -1.263 (p = 0.313).
Consequently, a history of allergic disease presents a strong positive correlation (B = 4.652, p = 0.001), suggesting that children with a history of allergies are more likely to experience intellectual disabilities. The maternal history of allergic disease also shows a significant association with a coefficient of 3.247 (p = 0.014), indicating a potential connection between maternal allergic conditions and cognitive challenges in offspring. The presence of anemia during pregnancy is marked by a coefficient of 3.070 (p = 0.046), pointing to an increased risk of intellectual disabilities for children exposed to maternal anemia. Lastly, various durations of electronic screen time exposure were analyzed, but none showed statistically significant associations.
In Model 2, which adjusts for potential confounders, notable changes occur. The significance of age persists, with a coefficient of -0.015 (95% CI: -0.027 to -0.004, p = 0.011), indicating that older children remain less likely to have intellectual disabilities after adjusting for other variables. However, the positive association between birth and gestational age is not statistically significant (p = 0.128), indicating that this association is no longer significant after controlling for other factors. Head circumference remains significant in Model 2, with a coefficient of 0.175 (95% CI: 0.051 to 0.300, p = 0.006), underscoring its role as a risk factor for intellectual disabilities even after adjustment. The caregiver’s education level remains significantly associated with a lower risk, as indicated by a coefficient of -2.116 (95% CI: 0.121 to 0.469, p = 0.002). The history of allergic disease remains positively associated, yielding an aOR of 2.768 (p = 0.096), indicating an ongoing but marginally significant relationship. Conversely, maternal history of allergic disease is less significant in Model 2 (aOR = 1.696, p = 0.517), suggesting that other factors may have confounded the initial association. The association between anemia during pregnancy is attenuated in Model 2 (aOR = 3.355, p = 0.142), indicating a loss of association after controlling for other variables. Electronic screen time exposure varies substantially, with no significant findings after adjustment.
| Variables | Model 1 B | 95%CI for B | P-value | Model 2 B | 95%CI for B | P-value |
| Age (Months) | -0.018 | (-0.031, -0.004) | 0.010* | -0.015 | (-0.027, -0.004) | 0.011* |
| Birth Gestational Age (weeks) | 0.121 | (0.007, 0.235) | 0.038* | 0.128 | (0.017, 0.239) | 0.024* |
| Head Circumference (cm) | 0.174 | (0.044, 0.304) | 0.009* | 0.175 | (0.051, 0.300) | 0.006* |
| Factors | Model 1 B | Crude OR (95%CI) | P-value | Model 2 B | aOR (95%CI) | P-value |
| Education level of caregiver | ||||||
| Bachelor’s degree or above | -2.707 | 0.067(0.008-0.524) | 0.010* | -2.116 | 0.121(0.031-0.469) | 0.002* |
| Middle school and below | -1.263 | 0.283(0.024-3.284) | 0.313 | -1.004 | 0.366(0.109-1.230) | 0.104 |
| Specialty/high school | Ref | – | – | Ref | – | – |
| History of allergic disease | ||||||
| No | Ref | – | – | Ref | – | – |
| Yes | 4.652 | 104.835(6.420-1711.871) | 0.001* | 1.018 | 2.768(0.835-9.170) | 0.096 |
| Presence of ADHD | ||||||
| Yes | Ref | – | – | Ref | – | – |
| No | -1.300 | 0.273(0.071- 1.052) | 0.059 | -0.146 | 0.864(0.329-2.271) | 0.767 |
| Maternal nutrient supplement | ||||||
| Not supplemented | -2.591 | 0.075(0.004-1.312) | 0.076 | -0.271 | 0.763(0.194-3.004) | 0.699 |
| Supplemented | Ref | – | – | Ref | – | – |
| Maternal history of allergic disease | ||||||
| No | Ref | – | – | Ref | – | – |
| Yes (allergic rhinitis, conjunctivitis, dermatitis, etc.) | 3.247 | 25.704(1.953-338.385) | 0.014* | 0.528 | 1.696(0.343-8.392) | 0.517 |
| Anemia during pregnancy | ||||||
| No | Ref | – | – | Ref | – | – |
| Yes | 3.070 | 21.537(1.063-436.212) | 0.046* | 1.211 | 3.355(0.666-16.913) | 0.142 |
| Electronic screen time exposure | ||||||
| Less than 1 hour | Ref | – | – | Ref | – | – |
| 1-2 hours | 1.147 | 3.149(0.556-17.845) | 0.195 | 0.270 | 1.309(0.459-3.738) | 0.614 |
| More than 2 hours | -1.018 | 2.769(0.471-16.268) | 0.260 | 0.496 | 1.642(0.518-5.202) | 0.399 |
Table 1: Factors influencing intellectual disabilities for children aged 4 to 10
Note: Model 1: unadjusted model; Model 2: adjusted for age, sex, height, weight, vitamin A, vitamin D, history of allergic disease, birth weight, adverse life history during pregnancy, amniotic fluid during pregnancy, umbilical cord during pregnancy, placental status, gestational diabetes, hypertension during pregnancy, gestational hypothyroidism, perinatal infection, intracranial hemorrhage at birth, birth asphyxia, hyperbilirubinemia
Proportion of children with and without ADHD: Figure 2 illustrates the distribution of children diagnosed with ADHD compared to those without the disorder. Specifically, the chart shows 41 (29.3%) children with ADHD. In contrast, the chart for children without ADHD reveals a significantly larger group, comprising 99 (70.7%) individuals.
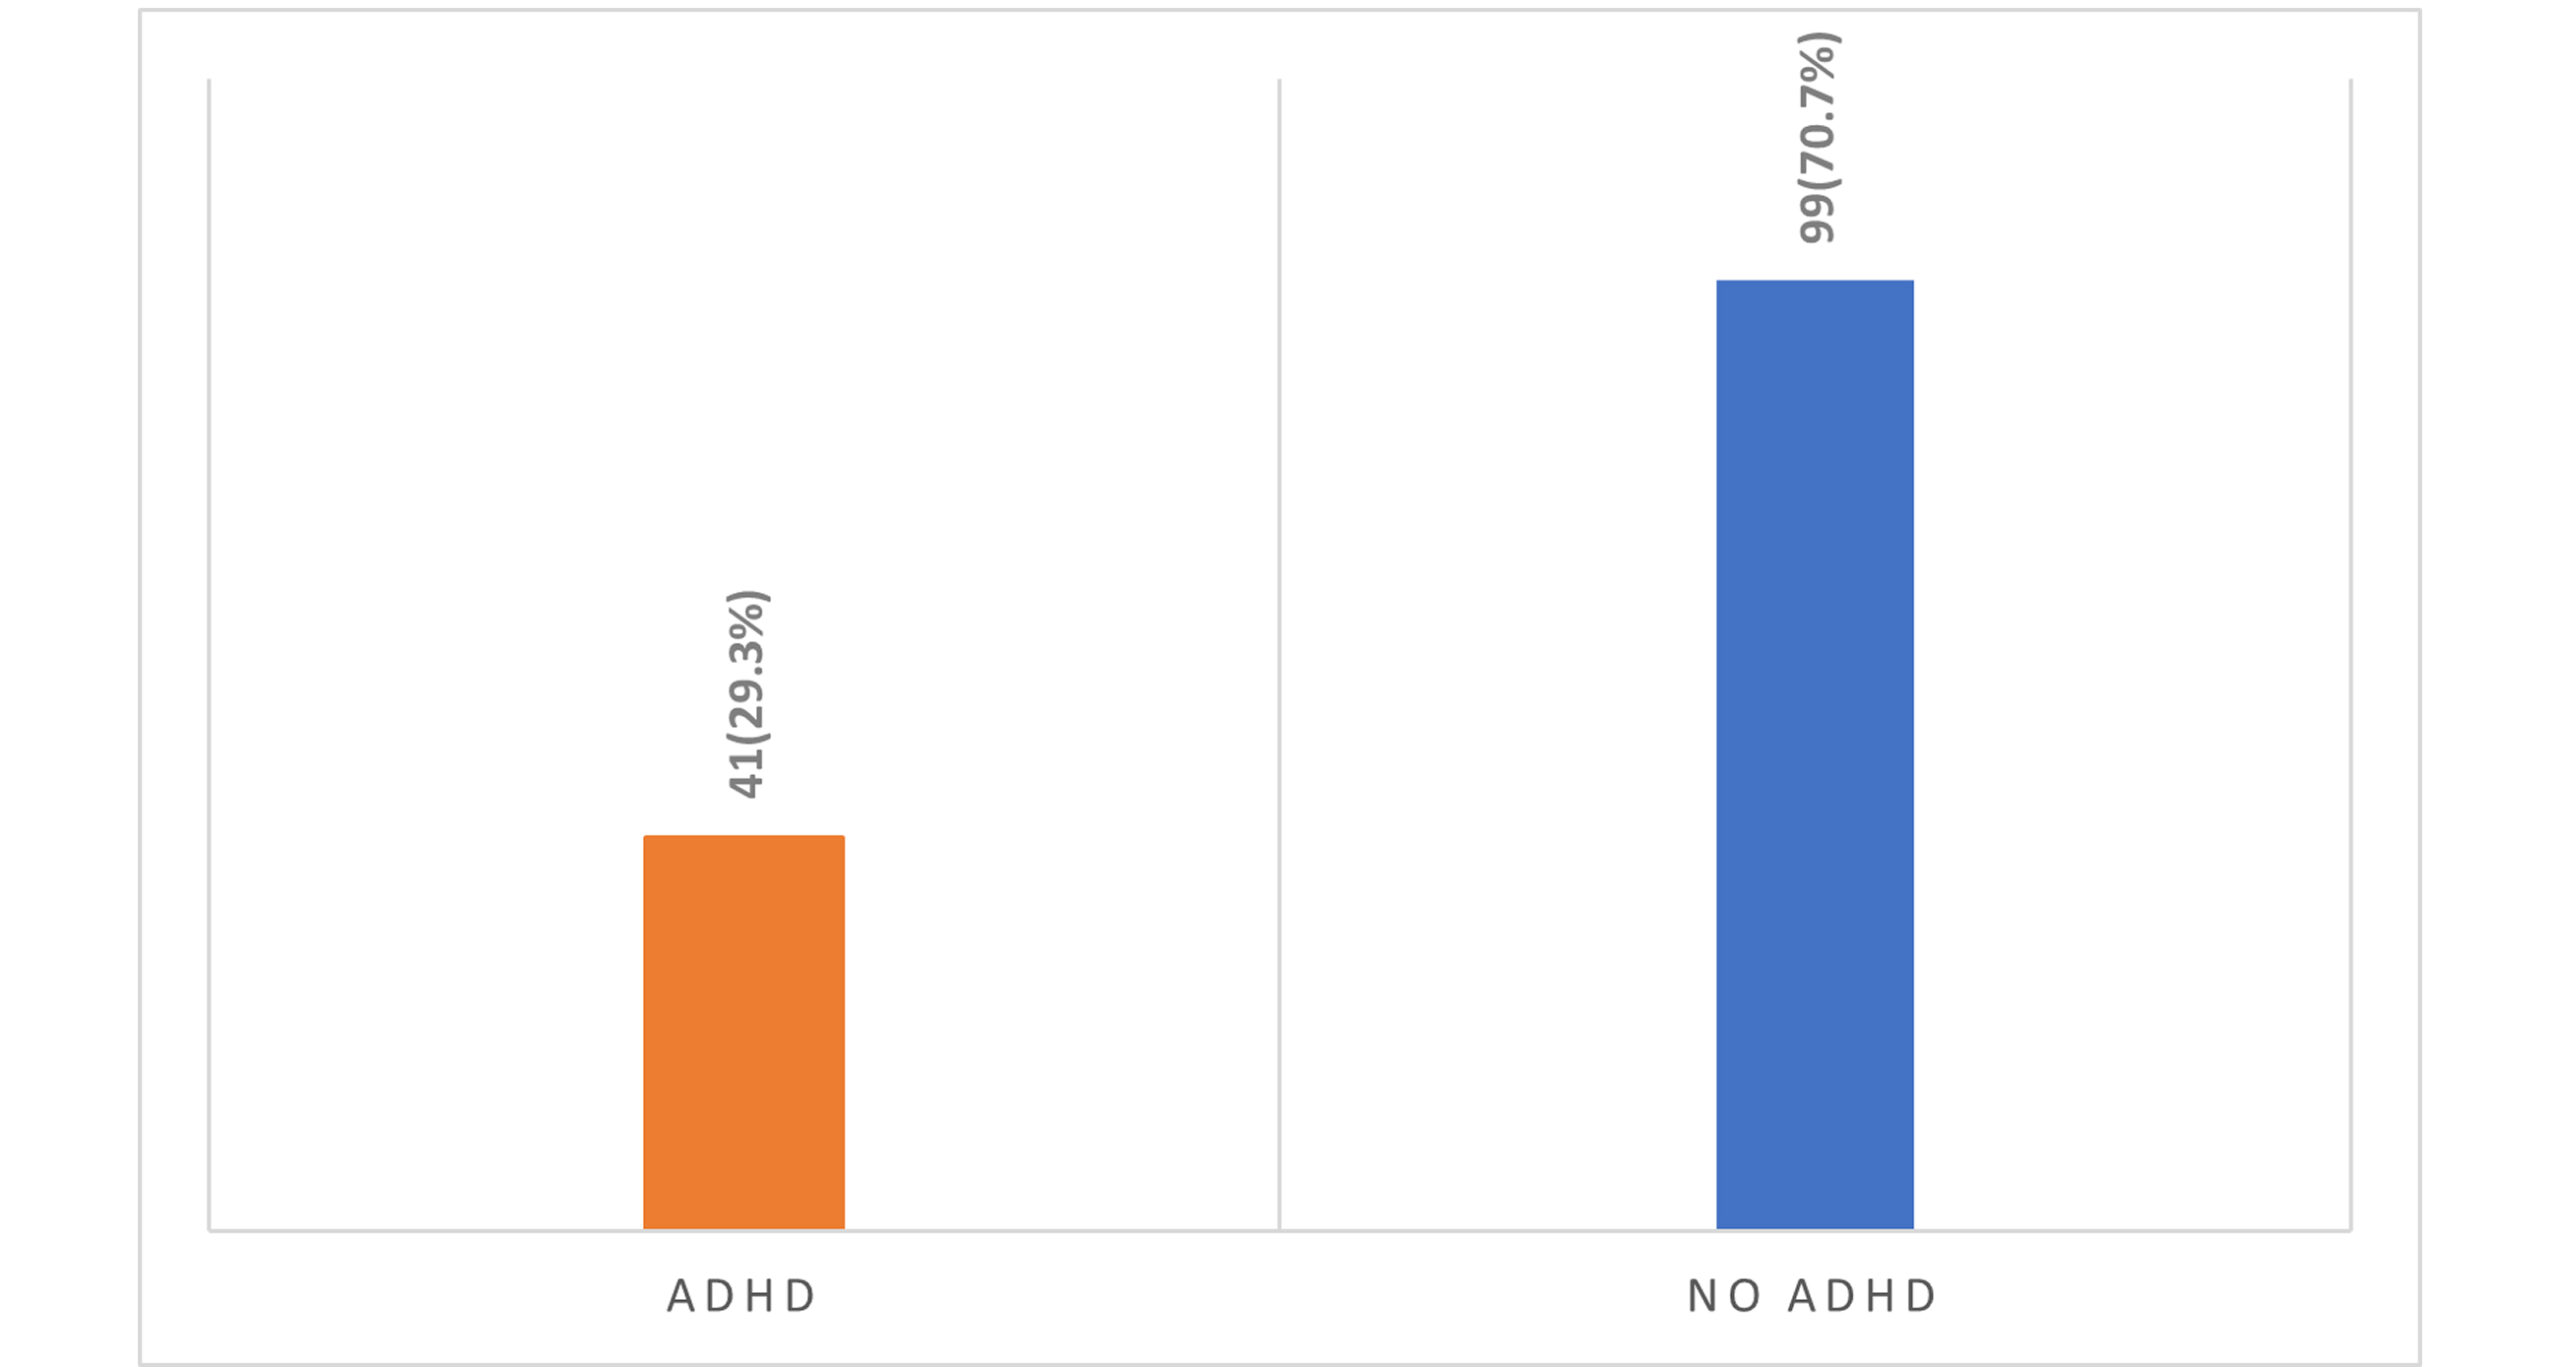
Figure 3: The proportion of children with and without ADHD
Comparative analysis of IQ Levels in Children with and without ADHD: Figure 3 compares IQ levels among children diagnosed with ADHD and those without the disorder. The bar graph illustrates three categories: Normal, Marginal Level, and Developmental Delay. The significant difference indicates a notable disparity in the proportion of children with normal IQ levels between the children with and without ADHD. In the normal IQ level category, 30 children with ADHD are reported, while a significantly higher number, 76 children without ADHD, fall into the other category.
For the Marginal Level category, only four children with ADHD are recorded, compared to 12 children without ADHD. This suggests that a small fraction of children with ADHD fall into the marginal IQ category, while it is more frequent among children without the disorder.
In the Developmental delay category, there are seven children with ADHD versus 11 children without ADHD. This indicates that developmental delays are observed among both groups, but are slightly more common in children without ADHD.
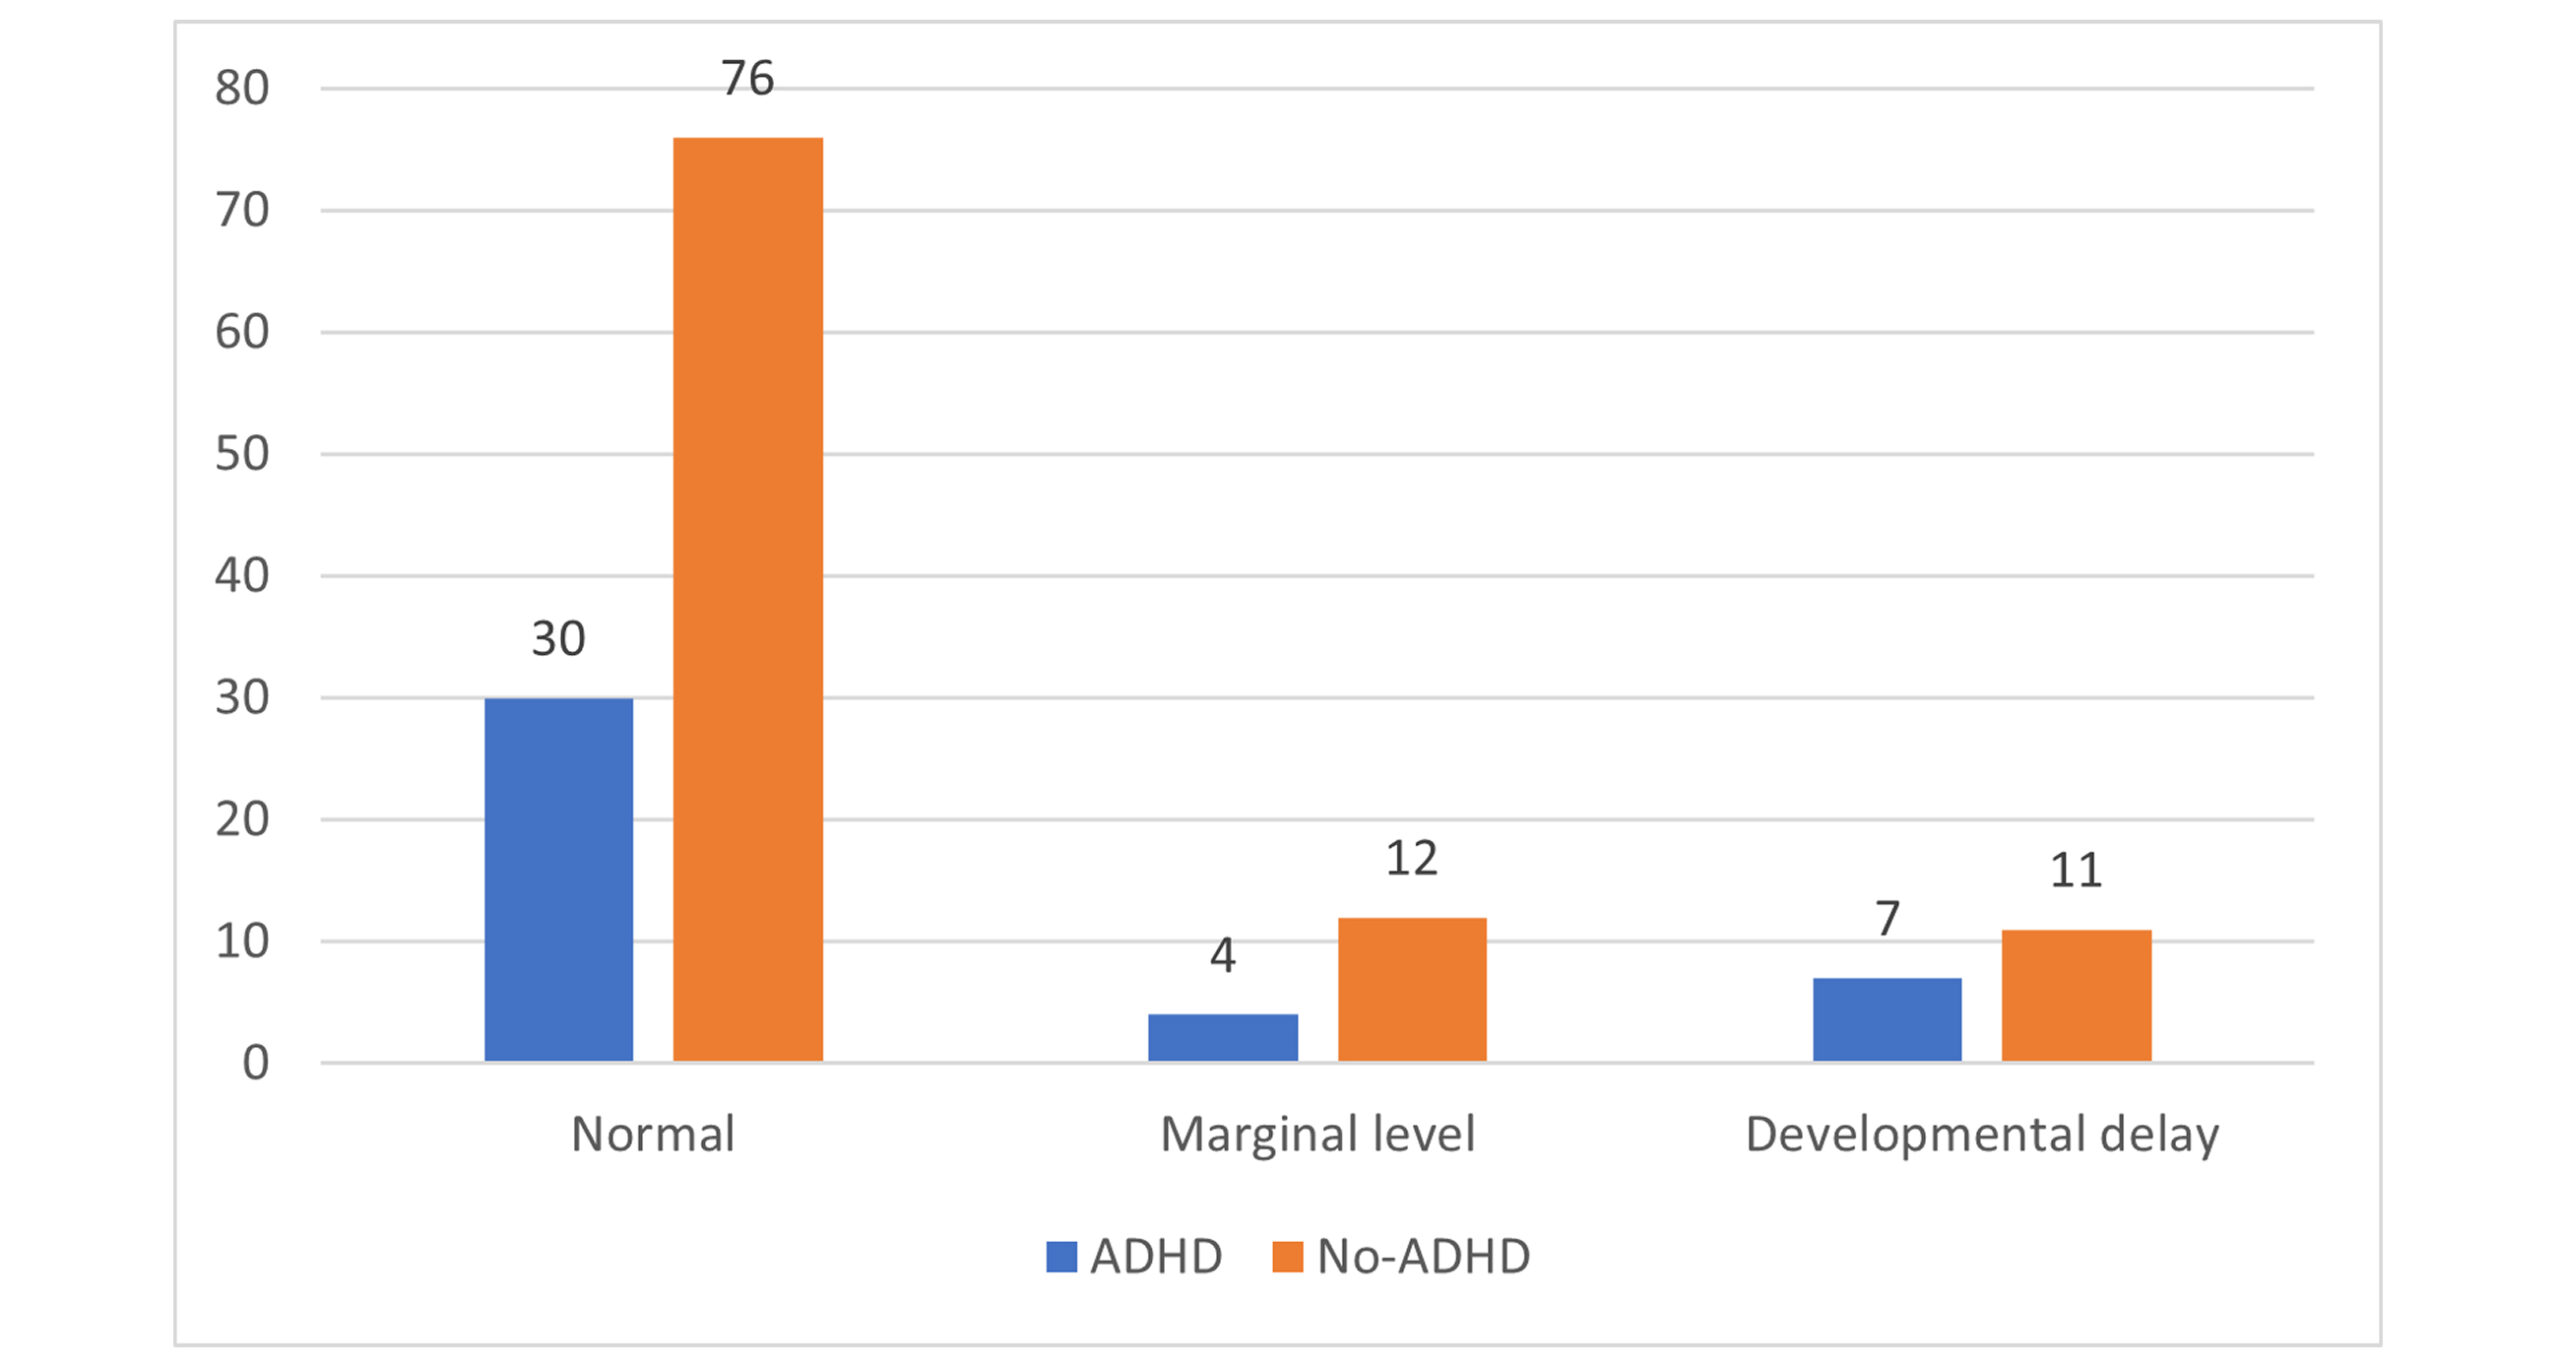
Figure 4: Comparative analysis of IQ levels in children with and without ADHD
Influencing factors associated with ADHD among children aged 4 to 10: Table 2 presents the results of two models examining factors associated with ADHD in this age group. In Model 1, several factors are significantly associated with ADHD. The child’s age shows a coefficient of 0.005 (95% CI: 0.000 to 0.009) with a p-value of 0.064. This indicates that as children age, there is a slight increase in the likelihood of ADHD, though this association is not statistically significant. The result shows a higher maternal weight with a reduced risk of ADHD. Maternal weight before delivery exhibits a negative relationship with ADHD, with a coefficient of -0.007 (95% CI: -0.011 to -0.002; p-value of 0.006).
The caregiver’s education level shows a coefficient of -0.953 for caregivers with a bachelor’s degree or higher (95% CI: -1.707 to -0.481, p = 0.408), suggesting a potential reduction in ADHD risk, although this effect is not statistically significant. For individuals with a middle school education or lower, the coefficient is 0.534 (p = 0.192), indicating no significant association with ADHD.
Regarding foster guardianship, a coefficient of -1.023 (95% CI: 0.360 to 0.312, p = 0.312) suggests that children under the care of relatives do not exhibit a significant reduction in ADHD risk. The presence of intellectual deficiency is associated with a coefficient of -0.203 (95% CI: 0.754 to 2.649; p = 0.659), indicating no significant association with ADHD. The parenting style impacts ADHD risk, with the authoritative style serving as a reference.
Furthermore, the democratic parenting style has a coefficient of 1.684 (p = 0.088), indicating a positive association with ADHD. In contrast, the ignoring type shows a significant positive association with a coefficient of 1.908 (p < 0.001), suggesting that neglectful parenting is associated with a higher likelihood of ADHD. The family history of ADHD presents a significant association (B = -1.010, p = 0.036), indicating a positive relationship between family history and the disorder. Complications related to the umbilical cord during pregnancy have a significant positive association with a coefficient of 2.003 (p = 0.025), suggesting that such complications may increase the risk of ADHD. Electronic screen time exposure does not demonstrate significant findings. Lastly, with respect to the family environment, the family harmony variable shows no significant effect. In contrast, a divorced or unstable family environment has a coefficient of -0.292 (p = 0.754), indicating no substantial correlation.
In Model 2, which accounts for potential confounders, some variables exhibit changes in significance. The child’s age remains statistically significant, with a coefficient of 0.004 (95% CI: 0.000 to 0.008, p = 0.036), indicating that older children are more likely to exhibit ADHD after adjusting for other factors. The negative relationship with maternal weight before delivery is confirmed, with a coefficient of -0.005 (95% CI: -0.008 to -0.002, p = 0.003), indicating that higher maternal weight consistently correlates with a reduced ADHD risk. However, the significance of caregiver education diminishes in Model 2, with the coefficient for caregivers holding a bachelor’s degree being 1.831 (95% CI: 0.667 to 5.027, p = 0.241), suggesting that the relationship with ADHD weakens after accounting for other variables.
Parenting style continues to play a significant role, with the democratic style showing a coefficient of 1.559 (p = 0.033), indicating that this parenting method is associated with an increased likelihood of ADHD (OR = 4.753; 95% CI: 1.134 to 19.925). The ignoring style is associated with a significant positive coefficient (1.686; p = 0.041), consistent with the finding that neglectful parenting correlates with ADHD (OR = 5.396; 95% CI: 1.068-27.261).
For the family history of ADHD, this variable loses significance in Model 2, with an adjusted odds ratio of 0.722 (95% CI: 0.108 to 4.823; p = 0.737), suggesting that the initial strong association may not persist after adjusting for other confounding factors.
Overall, the comparison between Model 1 and Model 2 reveals that the child’s age and maternal weight before delivery are significant after adjustment. The parenting styles reflect complex relationships with ADHD, while the significance of caregiver education and family history diminishes when controlling for other factors.
| Variables | Model 1 B | 95% CI for B | P-value | Model 2 B | 95% CI for B | P-value |
| Age (months) | 0.005 | (0.000, 0.009) | 0.064 | 0.004 | (0.000-0.008) | 0.036* |
| Mother’s weight before delivery | -0.007 | (-0.011, -0.002) | 0.006* | -0.005 | (-0.008-0.002) | 0.003* |
| Factors | Model 1 B | Crude OR (95% CI) | P-value | Model 2 B | Adjusted OR (95% CI) | P-value |
| Education level of the caregiver | ||||||
| Bachelor’s degree or above | -0.953 | 1.707 (0.481-6.054) | 0.408 | 0.605 | 1.831 (0.667-5.027) | 0.241 |
| Middle school and below | 0.534 | 0.386 (0.092-1.615) | 0.192 | -0.700 | 0.497(0.147-1.681) | 0.261 |
| Specialty/high school | Ref | – | – | Ref | – | – |
| Foster guardian | ||||||
| Grandparents or great-grandparents | -1.023 | 0.360 (0.049-2.615) | 0.312 | -0.336 | 0.715 (0.169-3.023) | 0.648 |
| Parents | Ref | – | – | Ref | – | – |
| Presence of intellectual deficiency | ||||||
| Yes | -0.203 | 0.754 (.215-2.649) | 0.659 | -0.314 | 0.731 (0.255-2.097) | 0.560 |
| No | Ref | – | – | Ref | – | – |
| Parenting style | ||||||
| Authoritative type | Ref | – | – | Ref | – | – |
| Democratic type | 1.684 | 5.386 (0.776-37.358) | 0.088 | 1.559 | 4.753 (1.134-19.925) | 0.033* |
| Ignoring type | 1.908 | 6.740 (0.911-49.836) | 0.062 | 1.686 | 5.396 (1.068-27.261) | 0.041* |
| Family history of ADHD | ||||||
| No | Ref | – | – | |||
| Yes (allergic rhinitis, conjunctivitis, dermatitis, etc.) | -1.010 | 0.364 (0.036-3.737) | -1.010 | -0.325 | 0.722 (0.108-4.823) | 0.737 |
| Umbilical cord during pregnancy | ||||||
| No | Ref | – | – | Ref | – | – |
| Yes | 2.003 | 7.409 (1.278-42.942) | 0.025* | 1.316 | 3.730 (1.125-12.359) | 0.031* |
| Electronic screen time exposure | ||||||
| Less than 1 hour | Ref | – | – | Ref | – | – |
| 1-2 hours | -0.546 | 0.579 (0.179-1.878) | 0.363 | -0.436 | 0.647 (0.240-1.744) | 0.389 |
| More than 2 hours | -0.706 | 0.493 (0.152-1.605) | 0.241 | -0.544 | 0.580 (0.205-1.644) | 0.306 |
| Children’s family environment | ||||||
| Family harmony | Ref | – | – | Ref | – | – |
| Divorced Parents or Unstable Family Environment | -0.292 | 0.747 (0.120-4.638) | 0.754 | -0.172 | 0.842 (0.169-.189) | 0.834 |
Table 2: Factors influencing ADHD among children aged 4 to 10
Note: Model 1: unadjusted model; Model 2: adjusted for sex, height, weight, and education level, head circumference; adjusted for age, sex, height, weight, and education level, head circumference, history of allergies, serum vit A and E, and love for sweet
Discussion
The co-occurrence of ID and ADHD in children represents a significant public health concern with profound implications for developmental trajectories, educational outcomes, and long-term psychosocial functioning.[26] While ID and ADHD are distinct neurodevelopmental disorders, their overlapping symptomatology and shared risk factors necessitate multiple explorations of the multifactorial pathways that contribute to their manifestation.[14] This study focused on children aged 4-10 and employed multivariate analysis to disentangle the various determinants underlying these ID and ADHD.
Our findings reveal a heterogeneous distribution of cognitive and behavioral profiles within the study population, highlighting significant variability in cognitive functioning among children. As illustrated in Figure 1, 75.7% of participants fell within the normal IQ range. In contrast, a noteworthy segment of participants exhibited marginal (11.4%) or developmental delays (12.9%). This stratification highlights the diverse cognitive profiles present in this age group and emphasizes that nearly one-quarter of participants face borderline or clinically significant challenges. Such variability warrants a complex understanding of cognitive outcomes and necessitates tailored intervention strategies that address individual needs.
Complementing these cognitive assessments, Figure 2 highlights the prevalence of ADHD within our cohort, with 23.3% meeting the diagnostic criteria for the disorder, while 76.7% did not. The substantial proportion of children diagnosed with ADHD is particularly noteworthy, as it reinforces the importance of recognizing this condition as a prevalent concern in pediatric populations.
Together, these distributions reveal the clinical relevance of separating the risk factors associated with ID and ADHD. Both independent and comorbid conditions pose distinct challenges requiring specialized care approaches. This finding aligns with existing literature indicating that neurodevelopmental disorders often do not present in isolation, but rather as part of a broader spectrum of cognitive and behavioral issues.[27,28]
By adopting a multivariate framework, this study advances the understanding of how genetic predispositions, prenatal exposures, socioeconomic disparities, and familial dynamics interact to shape risk profiles for each disorder.
Limitations: This study has some limitations that merit careful consideration. First, a cross-sectional design inherently restricts the ability to infer causality between the examined variables and intellectual disability. While regression analyses identified statistical associations, the term “predictor” should be interpreted cautiously, as it reflects correlation rather than causation. Longitudinal studies that track developmental trajectories from gestation through childhood are essential for establishing temporal and directional relationships.
Second, data on risk factors, such as maternal health history and prenatal complications, were obtained exclusively through parent-reported measures, with no corroboration from medical records or clinical evaluations. This approach may introduce recall bias and inaccuracies, particularly for conditions such as gestational diabetes or anemia, which may be underreported or subjectively interpreted. Similarly, diagnoses of comorbid psychiatric disorders relied on clinical judgment rather than standardized diagnostic tools.
Finally, the reliance on self-reported data, such as maternal nutrition and caregiver education levels, introduces social desirability bias. Participants may overreport adherence to health recommendations or underreport behaviors perceived as stigmatizing, potentially distorting observed associations. Future research should integrate objective measures, such as biomarker assays or electronic health records, to enhance data accuracy.
These limitations emphasize the need for longitudinal, multi-center studies with diverse cohorts and multimodal data collection to strengthen causal inference and ensure findings are broadly applicable.
Recommendation: This study recommends enhancing maternal health through nutritional support, providing parental education programs to improve understanding of child development, and fostering integrated care approaches among healthcare providers, educators, and mental health professionals. Early developmental screenings are also crucial for early identification and intervention. Further research on risk factors and their impact on neurodevelopment is needed to improve access to psychological and educational resources for affected children and their families.
Conclusion
This study highlights the complex factors influencing ID and ADHD in children aged 4 to 10. Key predictors include age, gestational parameters, caregiver education, and maternal nutrition. The findings indicate that higher caregiver education levels improve children’s cognitive outcomes, whereas maternal dietary supplementation during pregnancy may reduce the risk of ID. Significantly, the study found associations between maternal allergic disease and ID, along with a notable occurrence of ADHD in the cohort, suggesting overlapping risk factors. Anemia during pregnancy emerged as another concern affecting cognitive and behavioral outcomes. Ultimately, the study emphasizes the need for holistic interventions that address both ID and ADHD, promoting effective strategies for prevention, early intervention, and support to improve developmental outcomes for affected children.
References
- Tassé MJ, Grover M. American Association on Intellectual and Developmental Disabilities (AAIDD). 2013. doi:10.1007/978-1-4419-1698-3_1820
Crossref | Google Scholar - Ageranioti-Bélanger S, Brunet S, D’Anjou G, Tellier G, Boivin J, Gauthier M. Behaviour disorders in children with an intellectual disability. Paediatr Child Health. 2012;17(2):84-88. doi:10.1093/pch/17.2.84
PubMed | Crossref | Google Scholar - Weitzman C, Wegner L; Section on Developmental and Behavioral Pediatrics; Promoting optimal development: screening for behavioral and emotional problems. Pediatrics. 2015;135(2):384-395. doi:10.1542/peds.2014-3716
PubMed | Crossref | Google Scholar - Barbaresi WJ, Campbell L, Diekroger EA, et al. Society for Developmental and Behavioral Pediatrics Clinical Practice Guideline for the Assessment and Treatment of Children and Adolescents with Complex Attention-Deficit/Hyperactivity Disorder. J Dev Behav Pediatr. 2020;41 Suppl 2S:S35-S57. doi:10.1097/DBP.0000000000000770
PubMed | Crossref | Google Scholar - Shevell M, Ashwal S, Donley D, et al. Practice parameter: evaluation of the child with global developmental delay [RETIRED]: report of the Quality Standards Subcommittee of the American Academy of Neurology and The Practice Committee of the Child Neurology Society. Neurology. 2003;60(3):367-380. doi:10.1212/01.wnl.0000031431.81555.16
PubMed | Crossref | Google Scholar - Thapar A, Cooper M. Attention deficit hyperactivity disorder. Lancet. 2016;387(10024):1240-1250. doi:10.1016/S0140-6736(15)00238-X
PubMed | Crossref - Pliszka S; AACAP Work Group on Quality Issues. Practice parameter for the assessment and treatment of children and adolescents with attention-deficit/hyperactivity disorder. J Am Acad Child Adolesc Psychiatry. 2007;46(7):894-921. doi:10.1097/chi.0b013e318054e724
PubMed | Crossref | Google Scholar - Wolraich ML, Hagan JF Jr, Allan C, et al. Clinical Practice Guideline for the Diagnosis, Evaluation, and Treatment of Attention-Deficit/Hyperactivity Disorder in Children and Adolescents. Pediatrics. 2019;144(4):e20192528. doi:10.1542/peds.2019-2528
PubMed | Crossref | Google Scholar - Echavarría-Ramírez LM, Tirapu-Ustárroz J. Exploración neuropsicológica en niños con discapacidad intelectual [Neuropsychological examination in children with intellectual disabilities]. Rev Neurol. 2021;73(2):66-76. doi:10.33588/rn.7302.2021025
PubMed | Crossref | Google Scholar - Reschly DJ. Documenting the developmental origins of mild mental retardation. Appl Neuropsychol. 2009;16(2):124‑134. doi:10.1080/09084280902864469
PubMed | Crossref | Google Scholar - Totsika V, Liew A, Absoud M, Adnams C, Emerson E. Mental health problems in children with intellectual disability. Lancet Child Adolesc Health. 2022;6(6):432-444. doi:10.1016/S2352-4642(22)00067-0
PubMed | Crossref | Google Scholar - Chiurazzi P, Pirozzi F. Advances in understanding – genetic basis of intellectual disability. F1000Res. 2016;5:F1000 Faculty Rev-599. doi:10.12688/f1000research.7134.1
PubMed | Crossref | Google Scholar - Maulik PK, Mascarenhas MN, Mathers CD, Dua T, Saxena S. Prevalence of intellectual disability: a meta-analysis of population-based studies. Res Dev Disabil. 2011;32(2):419-436. doi:10.1016/j.ridd.2010.12.018
PubMed | Crossref | Google Scholar - Peterson RL, Pennington BF. Developmental dyslexia. Lancet. 2012;379(9830):1997-2007. doi:10.1016/S0140-6736(12)60198-6
PubMed | Crossref | Google Scholar - Houtrow AJ, Larson K, Olson LM, Newacheck PW, Halfon N. Changing trends of childhood disability, 2001-2011. Pediatrics. 2014;134(3):530-538. doi:10.1542/peds.2014-0594
PubMed | Crossref | Google Scholar - Leonard H, Wen X. The epidemiology of mental retardation: challenges and opportunities in the new millennium. Ment Retard Dev Disabil Res Rev. 2002;8(3):117-134. doi:10.1002/mrdd.10031
PubMed | Crossref | Google Scholar - van Karnebeek CD, Scheper FY, Abeling NG, et al. Etiology of mental retardation in children referred to a tertiary care center: a prospective study. Am J Ment Retard. 2005;110(4):253-267. doi:10.1352/0895-8017(2005)110(253:EOMRIC)2.0.CO;2
PubMed | Crossref | Google Scholar - Belkady B, Elkhattabi L, Elkarhat Z, et al. Chromosomal Abnormalities in Patients with Intellectual Disability: A 21-Year Retrospective Study. Hum Hered. 2018;83(5):274-282. doi:10.1159/000499710
PubMed | Crossref | Google Scholar - Miller DT, Adam MP, Aradhya S, et al. Consensus statement: chromosomal microarray is a first-tier clinical diagnostic test for individuals with developmental disabilities or congenital anomalies. Am J Hum Genet. 2010;86(5):749-764. doi:10.1016/j.ajhg.2010.04.006
PubMed | Crossref | Google Scholar - Wong LJ. Molecular genetics of mitochondrial disorders. Dev Disabil Res Rev. 2010;16(2):154-162. doi:10.1002/ddrr.104
PubMed | Crossref | Google Scholar - Malcolm S, Clayton-Smith J, Nichols M, et al. Uniparental paternal disomy in Angelman’s syndrome. Lancet. 1991;337(8743):694-697. doi:10.1016/0140-6736(91)90278-w
PubMed | Crossref | Google Scholar - Siegel M, McGuire K, Veenstra-VanderWeele J, et al. Practice Parameter for the Assessment and Treatment of Psychiatric Disorders in Children and Adolescents With Intellectual Disability (Intellectual Developmental Disorder). J Am Acad Child Adolesc Psychiatry. 2020;59(4):468-496. doi:10.1016/j.jaac.2019.11.018
PubMed | Crossref | Google Scholar - Bryson SE, Bradley EA, Thompson A, Wainwright A. Prevalence of autism among adolescents with intellectual disabilities. Can J Psychiatry. 2008;53(7):449-459. doi:10.1177/070674370805300710
PubMed | Crossref | Google Scholar - Ekstein S, Glick B, Weill M, Kay B, Berger I. Down syndrome and attention-deficit/hyperactivity disorder (ADHD). J Child Neurol. 2011;26(10):1290-1295. doi:10.1177/0883073811405201
PubMed | Crossref | Google Scholar - Wise JC, Sevcik RA, Romski M, Morris RD. The relationship between phonological processing skills and word and nonword identification performance in children with mild intellectual disabilities. Res Dev Disabil. 2010;31(6):1170-1175. doi:10.1016/j.ridd.2010.08.004
PubMed | Crossref | Google Scholar - Zuckerbrot RA, Cheung A, Jensen PS, Stein REK, Laraque D; GLAD-PC STEERING GROUP. Guidelines for Adolescent Depression in Primary Care (GLAD-PC): Part I. Practice Preparation, Identification, Assessment, and Initial Management. Pediatrics. 2018;141(3):e20174081. doi:10.1542/peds.2017-4081
PubMed | Crossref | Google Scholar - Levetown M; American Academy of Pediatrics Committee on Bioethics. Communicating with children and families: from everyday interactions to skill in conveying distressing information. Pediatrics. 2008;121(5):e1441-e1460. doi:10.1542/peds.2008-0565
PubMed | Crossref | Google Scholar - Esbensen AJ, Hooper SR, Fidler D, et al. Outcome Measures for Clinical Trials in Down Syndrome. Am J Intellect Dev Disabil. 2017;122(3):247-281. doi:10.1352/1944-7558-122.3.247
PubMed | Crossref | Google Scholar
Acknowledgments
We would like to express our sincere gratitude to all participating children and their caregivers for their cooperation and valuable contribution to this study. We also thank the clinical staff of the Department of Rehabilitation, Children’s Hospital of Nanjing Medical University, for their assistance in participant recruitment and data collection.
Funding
The following funding sources supported this study:
- National Natural Science Foundation of China – Youth Fund (Grant No. 81401864)
- Young Talents for Strengthening Health through Science and Education in Jiangsu Province (Grant No. QNRC2016089)
- Scientific Research Project of Jiangsu Maternal and Child Health Care Association (Grant No. FYX201907)
- General Project of Nanjing Municipal Health Commission (Grant No. YKK19108)
The funding bodies had no role in the study design, data collection, data analysis, manuscript preparation, or decision to publish.
Author Information
Corresponding Author:
Min Zhu
Department of Rehabilitation
Children’s Hospital of Nanjing Medical University, 72 Guangzhou Road, Nanjing Jiangsu 210008, China
Email: zhuzhujuly@njmu.edu.cn
Co-Authors:
Kimseang Nget, Xiaoke Zhao
Department of Rehabilitation
Children’s Hospital of Nanjing Medical University, Nanjing, China
Authors Contributions
All authors contributed to the Conceptualization, Investigation, and Data Curation by acquiring and critically reviewing the selected articles. They were collectively involved in the Writing – Original Draft preparation and Writing – Review & Editing to refine the manuscript. Additionally, all authors participated in supervising the work to ensure accuracy and completeness. The final manuscript was approved by all named authors for submission to the journal.
Ethical Approval
This study was conducted in accordance with the Declaration of Helsinki. Ethical approval was obtained from the Institutional Review Board of Nanjing Medical University before study initiation. Written informed consent was obtained from all parents or legal guardians of participating children before enrollment. Participation was voluntary, and confidentiality of all participant data was strictly maintained.
Conflict of Interest Statement
The authors declare that there are no conflicts of interest, financial or otherwise, related to this study.
Guarantor
Min Zhu acts as the guarantor of the study and accepts full responsibility for the integrity of the data, accuracy of analysis, and the overall content of the manuscript.
DOI
Cite this Article
Nget K, Zhu M, Zhao X. Influencing Factors Associated with Intellectual Disability and Attention Deficit Hyperactivity Disorder in Children Age 4 to 10 Years in a Chinese Population: A Multivariate Analysis. medtigo J Neurol Psychiatr. 2026;3(1):e3084311. doi:10.63096/medtigo3084311 Crossref