


 Author Affiliations
Abstract
Background: Inflammation during the menstrual cycle can be influenced by obesity. This study aimed to determine the effect of obesity on systemic inflammation during the menstrual cycle.
Methodology: We analysed National Health and Nutrition Examination Survey (NHANES; 1999–2006) data from biological females aged 18–45 years with body mass index (BMI) between 18.5 and 40.0 kg/m², available data on days since last menstrual period, and complete blood counts. Participants were categorized as normal weight (18.5–24.9 kg/m²) or overweight/obese (25.0–40.0 kg/m²). Periodicity was assessed using R (v4.4.0) with the Cosinor and Cosinor2 packages to estimate the midline estimation statistic of rhythm (MESOR), representing the rhythm-adjusted mean, amplitude (half the predictable peak-to-trough variation), and acrophase (peak timing).
Results: BMI stratification revealed differences in platelet, neutrophil, and leukocyte counts, but not monocyte counts, leading to significant differences in the neutrophil–lymphocyte–platelet ratio (NLPR), systemic inflammation response index (SIRI), C-reactive protein (CRP) to albumin ratio, aggregate index of systemic inflammation, and systemic immune-inflammation index (SII). Cosinor analysis showed significant rhythmicity for NLPR and SIRI (p<0.001). Amplitudes were similar across BMI groups; however, MESORs and acrophases differed for NLPR (p<0.05). For SIRI, amplitudes and MESORs were similar, but acrophases differed between BMI groups (p<0.05)
Conclusion: Inflammation during the menstrual cycle has periodicity, and obesity affects the overall midline of inflammation and the time at which the peak inflammation occurs. This is the first study to characterize the inflammatory fluctuations associated with the menstrual cycle and examine how they are affected by obesity.
Keywords
Menstruation, Inflammation, Menstrual cycle, Body mass index, Reproductive alterations.
Introduction
Inflammation is a pathological process where tissue injury or destruction due to cytology induces an acute inflammatory response, activating cellular and molecular pathways to moderate and reduce injury or infection.[1] If acute inflammation is not controlled, it can become chronic, also known as systemic inflammation, contributing to various chronic inflammatory diseases.[2] However, inflammation is also required to maintain normal bodily processes.[3] For example, inflammation must be downregulated during embryo implantation but increased for menstruation. Another example is the human circadian cycle, where inflammation, mediated by cytokines and leukocytes, peaks during the resting phase (night) and decreases during the active phase (day).[4] Systemic inflammation has a physiological impact on the menstrual cycle. For instance, elevated CRP has been associated with prolonged menstrual cycles and follicular phases.[1] Moreover, inflammation can affect the hypothalamic-pituitary-ovarian axis. Gonadotropin-releasing hormone is affected, directly altering the production of follicle-stimulating hormone (FSH) and luteinizing hormone (LH), all vital for the female sexual cycle. Anomalies within this axis generate infrequent or absent menstrual periods, abundant menstrual phases, or alterations in folliculogenesis, preventing the maturation of a dominant follicle and nullifying ovulation.[5,6] Lastly, inflammation is a significant factor in infertility, possibly through the menstrual cycle alterations.[7]
Inflammation is affected by modifiable factors, such as obesity (OB).[8,9] OB, characterized by excessive accumulation of adipose tissue, is associated with a higher risk for developing heart disease, diabetes, and infertility.[10] In females, excess adipocytes act on multiple cellular pathways of inflammation, insulin resistance, hypertension, and coagulation, affecting the differentiation and maturation of oocytes. Additionally, other reproductive functions will be affected, such as delays in endometrial maturation and embryo implantation, and an increase in the rate of spontaneous abortions.[11] OB is fundamental in developing metabolic pathologies, since excessive adiposity causes chronic systemic inflammation.8 Various studies have shown that individuals with OB have an increased count of neutrophils, lymphocytes, and platelets.[12-14] These blood cells, as a marker of systemic inflammation, via the prognostic indices such as SII, CAR, NLPR, SIRI, and AISI, can determine conditions like Still’s disease, stroke, fibrosis, and mortality.[15-18] The relationship between inflammation and OB posits that the effects of OB on the menstrual cycle could occur via inflammation. Since OB has been identified as a factor affecting platelets during the menstrual cycle, the objective was to evaluate how OB affects systemic inflammation fluctuations during the menstrual cycle.[19]
Methodology
Data source: This study was conducted following the strengthening of the reporting of observational studies in epidemiology (STROBE) guidelines (Supplement file 1). The NHANES database was used to assess how inflammation markers change throughout the menstrual cycle. NHANES is characterized by using complex, rigorous probability cluster designs and a multiple-stage sampling method to obtain a representative survey of the state of health and nutrition of the United States population. The data is freely available from the National Center for Health Statistics (NCHS) via the Centers for Disease Control and Prevention for public use. The NCHS Ethics Review Board approved NHANES data collection and use (https://wwwn.cdc.gov/nchs/nhanes/default.aspx). The Centers for Disease Control and Prevention conducted the survey, and all participants reviewed and signed a comprehensive informed consent. All procedures followed the Helsinki Declaration of 1975, as revised in 2008.
Study population: An eligibility criterion set was constructed according to the patient population, interventions, comparison groups, outcomes, and study design (PICOS) question scheme. The PICOS question was: In biological females with overweight (OW) or obesity (OB), compared to females with normal weight (NW), are there differences in systemic inflammation during the menstrual cycle, as determined by the cross-sectional data from NHANES? The systemic inflammation was determined using the following indices: SII, CAR, NLPR, SIRI, and AISI. The eligibility criteria reflected the PICOS components and the subsequent inclusion and exclusion criteria.
The participants had to have the following inclusion criteria: 1) biological females, >18 years old, 2) data on “days since the end of their period” (between 1 and 35 days), and 3) a BMI between 18.5 and 40.0 kg/m2. The exclusion criteria were 1) any liver or thyroid disease, 2) HIV infection, 3) treatment for anemia, 4) any cancer, 5) currently pregnant, breastfeeding, or had a pregnancy within the last year, 6) hysterectomy or ovariectomy, 7) endometriosis, or 8) any hormonal treatment.
Variables evaluated: Data from 1999 to 2006 were used for the analysis. All variables were downloaded from the NHANES website, which consisted of demographic data, anthropometric measurements, laboratory tests, and questionnaire data. The demographic variables included were biological sex (female/male), age (years), and ethnicity (Non-Hispanic White, Non-Hispanic Black, Mexican American, Other Hispanic, or Other Races). Anthropometric variables collected were weight (kg), height (cm), BMI (kg/m2), waist circumference (cm), systolic blood pressure (mmHg), and diastolic blood pressure (mmHg). Laboratory variables collected were FSH (mIU/mL), LH (mIU/mL), white blood cell count (n), red blood cell count (n), hemoglobin (g/dL), platelet count (×10³/µL), mean platelet volume (fL), and number and percentage of lymphocytes, monocytes, segmented neutrophils, eosinophils, and basophils. Using BMI, the cohort was classified into participants with NW (18.5-24.9 kg/m²) and participants with OW/OB (25.0-40.0 kg/m²).
Statistical analysis: All analyses were carried out using the complex samples design option of the Statistical Package for the Social Sciences software, version 26.0 (SPSS, v.26.0), and the R software (v.4.4.0). Quantitative variables are presented as mean and standard error, whereas categorical variables are presented as a percent/frequency and standard error. Differences between categorical data were evaluated with the Rao Scott-Chi2 test. Differences between groups were evaluated using the general linear model and the designed adjusted T-Test. Rhythmicity during the menstrual cycle was detected using the “Cosinor” and “Cosinor2” packages for R. The Cosinor package fits a cosine curve and calculates the MESOR (midline estimation rhythm statistic, a rhythm-adjusted mean), amplitude (half of the change that is predictable in a cycle), and acrophase (time of highest value). The Cosinor models were adjusted according to weight (NW and OW/OB) as covariates. A significant cosine fit was established using the zero-amplitude test, and a Wald test was also performed to check the differences between amplitudes and acrophases when affected by the covariates. Cosine data is presented as the estimate with a 95% confidence interval (95% CI). The Cosinor data are displayed as means plots and standard errors. P-values <0.05 (two-tailed) were considered statistically significant.
Results
Selection of patient characteristics: The sample population has been used in a previous analysis.[19] Using the NHANES (1999-2006), 41,474 participants were identified; however, 48.9% of the cohort were males, and 36.5% of the cohort did not have acceptable information on the number of days since the end of their period and were excluded. Additionally, 3,132 participants were removed for having values for BMI or age outside the defined acceptance range, with another 983 participants removed for having potential conditions that could affect their menstruation or promote inflammation. Finally, 88 participants were removed due to a lack of data for at least one blood cell type, resulting in 1,854 participants being included in this analysis. The participants’ characteristics are presented in Table 1.
| Category | Total | NW | OW/OB | p-value a |
| Sample (n) | ||||
| Unweighted | 1854 | 831 | 1023 | |
| Weighted | 49,854,330 | 24,046,133 | 25,808,197 | |
| Age (years) | 32.7 ± 0.3 | 31.7 ± 0.4 | 33.5 ± 0.4 | 0.001 |
| <32 years (%) | 42.4 ± 1.7 | 47.7 ± 2.0 | 37.5 ± 2.6 | 0.002 |
| ³32 years (%) | 57.6 ± 1.7 | 52.3 ± 2.0 | 62.5 ± 2.6 | |
| Race (%) | ||||
| Non-Hispanic White | 61.4 ± 2.4 | 65.3 ± 2.6 | 57.6 ± 3.3 | <0.001 |
| Non-Hispanic Black | 12.6 ± 1.6 | 8.2 ± 1.7 | 16.8 ± 1.9 | |
| Mexican American | 10.4 ± 1.1 | 7.9 ± 1.0 | 12.7 ± 1.6 | |
| Other Hispanics | 7.9 ± 1.1 | 6.8 ± 1.2 | 8.9 ± 1.7 | |
| Other Races | 7.7 ± 1.1 | 11.7 ± 2.2 | 4.0 ± 0.8 | |
| Marital Status (%) | ||||
| Single | 32.0 ± 2.0 | 36.1 ± 2.8 | 28.1 ± 1.9 | <0.001 |
| Married | 56.1 ± 2.1 | 56.1 ± 3.2 | 56.1 ± 2.1 | |
| Divorced/Separated | 11.4 ± 1.1 | 7.5 ± 1.3 | 15.1 ± 1.6 | |
| Widowed | 0.5 ± 0.2 | 0.3 ± 0.2 | 0.7 ± 0.3 | |
| Poverty-to-income ratio | 2.8 ± 0.1 | 3.0 ± 0.1 | 2.6 ± 0.1 | <0.001 |
| Anthropometric measures | ||||
| Weight (kg) | 70.5 ± 0.7 | 59.0 ± 0.3 | 81.2 ± 0.8 | <0.001 |
| Height (m) | 163.1 ± 0.3 | 163.6 ± 0.4 | 162.7 ± 0.3 | 0.075 |
| Body-mass Index (kg/m2) | 26.5 ± 0.2 | 22.0 ± 0.1 | 30.6 ± 0.2 | <0.001 |
| Normal weight (%) | 48.2 ± 2.1 | 100 | – | – |
| Overweight (%) | 26.0 ± 1.6 | – | 50.3 ± 2.6 | |
| Obese (%) | 25.7 ± 1.7 | – | 49.7 ± 2.6 | |
| Waist circumference (cm) | 88.3 ± 0.6 | 78.6 ± 0.3 | 97.3 ± 0.7 | <0.001 |
| Systolic blood pressure (mmHg) | 111 ± 1 | 108 ± 1 | 114 ± 1 | <0.001 |
| Diastolic blood pressure (mmHg) | 68 ± 1 | 67 ± 1 | 69 ± 1 | 0.001 |
| Laboratory results | ||||
| C-reactive protein (mg/dL) | 0.30 ± 0.02 | 0.15 ± 0.02 | 0.43 ± 0.03 | <0.001 |
| Albumin (g/dL) | 4.29 ± 0.01 | 4.40 ± 0.01 | 4.19 ± 0.02 | <0.001 |
| Follicle-stimulating hormone (mIU/mL) | 7.7 ± 0.5 | 8.1 ± 0.6 | 7.3 ± 0.6 | 0.262 |
| Luteinizing hormone (mIU/mL) | 9.7 ± 0.9 | 10.6 ± 1.1 | 9.0 ± 1.2 | 0.260 |
| Days since last period | 15.1 ± 0.3 | 15.3 ± 0.4 | 15.0 ± 0.4 | 0.480 |
Table 1: Characteristics of the study participants
Abbreviations: NW: normal weight; OW/OB: overweight and obese.
Data is presented as mean or frequency ± standard error.
Differences between groups were calculated by using either the Rao-Scott Chi-square Test or using the General Linear Model. P-values <0.05 (two-tailed) were considered significant.
The total cohort had an average BMI of 26.5±0.2 kg/m2, with most of the cohort being participants with OW or OB (51.8%). When the cohort was divided into participants with NW and participants with OW/OB, there was a difference in the distribution for ethnicity, in which the predominant ethnicity was Non-Hispanic White; however, there was a higher proportion of Non-Hispanic Blacks and Mexican-Americans in participants with OW/OB. Similar results were observed for marital status, in which “Married” was the most common. As expected, weight, waist circumference, and CRP were higher in participants with OW/OB. Interestingly, there were similar proportions of participants with OW to participants with OB. Even though there were statistical differences between the groups, there were no clinical differences concerning age, systolic blood pressure, diastolic blood pressure, albumin, FSH, and LH. When complete blood counts were assessed, participants with OW/OB were associated with elevated red and white blood cell levels, number of lymphocytes, segmented neutrophils, basophils, and platelet count, but decreased monocyte percent (Table 2).
| Category | NW | OW/OB | p-value a |
| Complete blood count | |||
| Red blood cell (n) | 4.45 ± 0.02 | 4.52 ± 0.02 | 0.002 |
| White blood cell (n) | 7.07 ± 0.08 | 7.57 ± 0.11 | 0.001 |
| Lymphocytes | |||
| (n) | 2.09 ± 0.03 | 2.22 ± 0.03 | 0.002 |
| (%) | 30.50 ± 0.42 | 30.18 ± 0.37 | 0.633 |
| Monocytes | |||
| (n) | 0.52 ± 0.01 | 0.53 ± 0.01 | 0.535 |
| (%) | 7.50 ± 0.10 | 7.12 ± 0.10 | 0.007 |
| Segmented neutrophils | |||
| (n) | 4.23 ± 0.06 | 4.59 ± 0.09 | 0.006 |
| (%) | 58.78 ± 0.43 | 59.60 ± 0.44 | 0.274 |
| Eosinophils | |||
| (n) | 0.18 ± 0.01 | 0.18 ± 0.01 | 0.737 |
| (%) | 2.58 ± 0.10 | 2.42 ± 0.07 | 0.178 |
| Basophils | |||
| (n) | 0.04 ± 0.01 | 0.05 ± 0.01 | 0.023 |
| (%) | 0.68 ± 0.02 | 0.71 ± 0.03 | 0.427 |
| Hemoglobin (g/dL) | 13.56 ± 0.06 | 13.46 ± 0.07 | 0.207 |
| Platelet count (103/mL) | 284.64 ± 4.74 | 302.22 ± 3.12 | 0.008 |
| Mean platelet volume (fL) | 8.14 ± 0.05 | 8.18 ± 0.04 | 0.553 |
| Inflammation Indexes | |||
| NLPR | 0.81 ± 0.03 | 0.77 ± 0.02 | 0.260 |
| SIRI | 1.16 ± 0.04 | 1.17 ± 0.03 | 0.834 |
| CAR | 0.037 ± 0.004 | 0.106 ± 0.008 | <0.001 |
| AISI | 340 ± 15 | 355 ± 12 | 0.457 |
| SII | 629 ± 19 | 658 ± 17 | 0.291 |
Table 2: The effect obesity has on blood counts and inflammation
Abbreviations: AISI: Aggregate Index of Systemic Inflammation; CAR: C-reactive protein to albumin ratio; NLPR: neutrophil to platelet and lymphocyte ratio; NW: normal weight; OW/OB: overweight/obese; SII: Systemic Immune-Inflammation index; SIRI: Systemic inflammation response index.
Values are the mean standard error.
Differences between groups were calculated by using the General Linear Model. P-values <0.05 (two-tailed) were considered significant.
The association between systemic inflammation indices and BMI
When the systemic inflammation indices were evaluated by BMI, only the CAR index was elevated in participants with OW/OB (1.86-fold increase, p<0.001, Table 2). Scatterplots demonstrated significant weak associations between BMI and NLPR (r=-0.033, p<0.001), SIRI (r=0.047, p<0.001), CAR (r=0.340, p<0.001), AISI (r=0.077, p<0.001), and SII (r=0.086, p<0.001, Figure 1. Using multivariate linear regression, increases in BMI were associated with increases in the CAR (estimate=0.008, p<0.001), AISI (estimate=4.487, p=0.007), and SII (estimate=7.491, p=0.001), when age, marital status, ethnicity, and PIR were considered (Table 3).
| Category | Crude a | Model 1 b | Model 2 c |
| Complete Blood Counts | |||
| Segmented neutrophils (n) | 0.042 (0.018 – 0.065), 0.001 | 0.042 (0.020 – 0.065), <0.001 | 0.048 (0.025 – 0.071), <0.001 |
| Lymphocytes (n) | 0.013 (0.004 – 0.022), 0.004 | 0.014 (0.006 – 0.023), 0.002 | 0.010 (0.002 – 0.019), 0.020 |
| Monocytes (n) | 0.001 (0.000 – 0.003), 0.138 | 0.002 (0.000 – 0.003), 0.066 | 0.001 (-0.001 – 0.003), 0.219 |
| Platelet count (103/mL) | 2.216 (1.182- 3.250), <0.001 | 2.152 (1.125 – 3.178), <0.001 | 2.051 (0.964 – 3.138), <0.001 |
| C-reactive protein (mg/dL) | 0.034 (0.027 – 0.042), <0.001 | 0.033 (0.027 – 0.040), <0.001 | 0.032 (0.025 – 0.039), <0.001 |
| Albumin (g/dL) | -0.024 (-0.028 – -0.020), <0.001 | -0.024 (-0.027 – -0.020), <0.001 | -0.023 (-0.027 – -0.019), <0.001 |
| Inflammation Indexes | |||
| NLPR | -0.003 (-0.009 – 0.004), 0.434 | -0.003 (-0.010 – 0.004), 0.405 | 0.001 (-0.008 – 0.007), 0.910 |
| SIRI | 0.007 (-0.003 – 0.016), 0.181 | 0.007 (-0.002 – 0.016), 0.146 | 0.009 (-0.001 – 0.020), 0.077 |
| CAR | 0.009 (0.007 – 0.011), <0.001 | 0.009 (0.007 – 0.010), <0.001 | 0.008 (0.006 – 0.010), <0.001 |
| AISI | 3.725 (0.681 – 6.769), 0.017 | 3.818 (0.866 – 6.769), 0.012 | 4.487 (1.248 – 7.726), 0.007 |
| SII | 5.818 (1.501 – 10.136), 0.009 | 5.497 (1.275 – 9.736), 0.012 | 7.491 (3.025 – 11.958), 0.001 |
Table 3: Multivariate regression analysis for the association between BMI and blood counts as well as inflammation indices
Abbreviations: AISI: Aggregate Index of Systemic Inflammation; CAR: C-reactive protein to albumin ratio; NLPR: neutrophil to platelet and lymphocyte ratio; SII: Systemic Immune-Inflammation index; SIRI: Systemic inflammation response index.
Values are estimated (95% confidence interval), p-value. Values were calculated using a general linear model. P-values <0.05 (two-tailed) were considered significant.
a Crude: Unadjusted
b Model 1: Adjusted by Age
c Model 2: Model 1 + Martial + Race + PIR
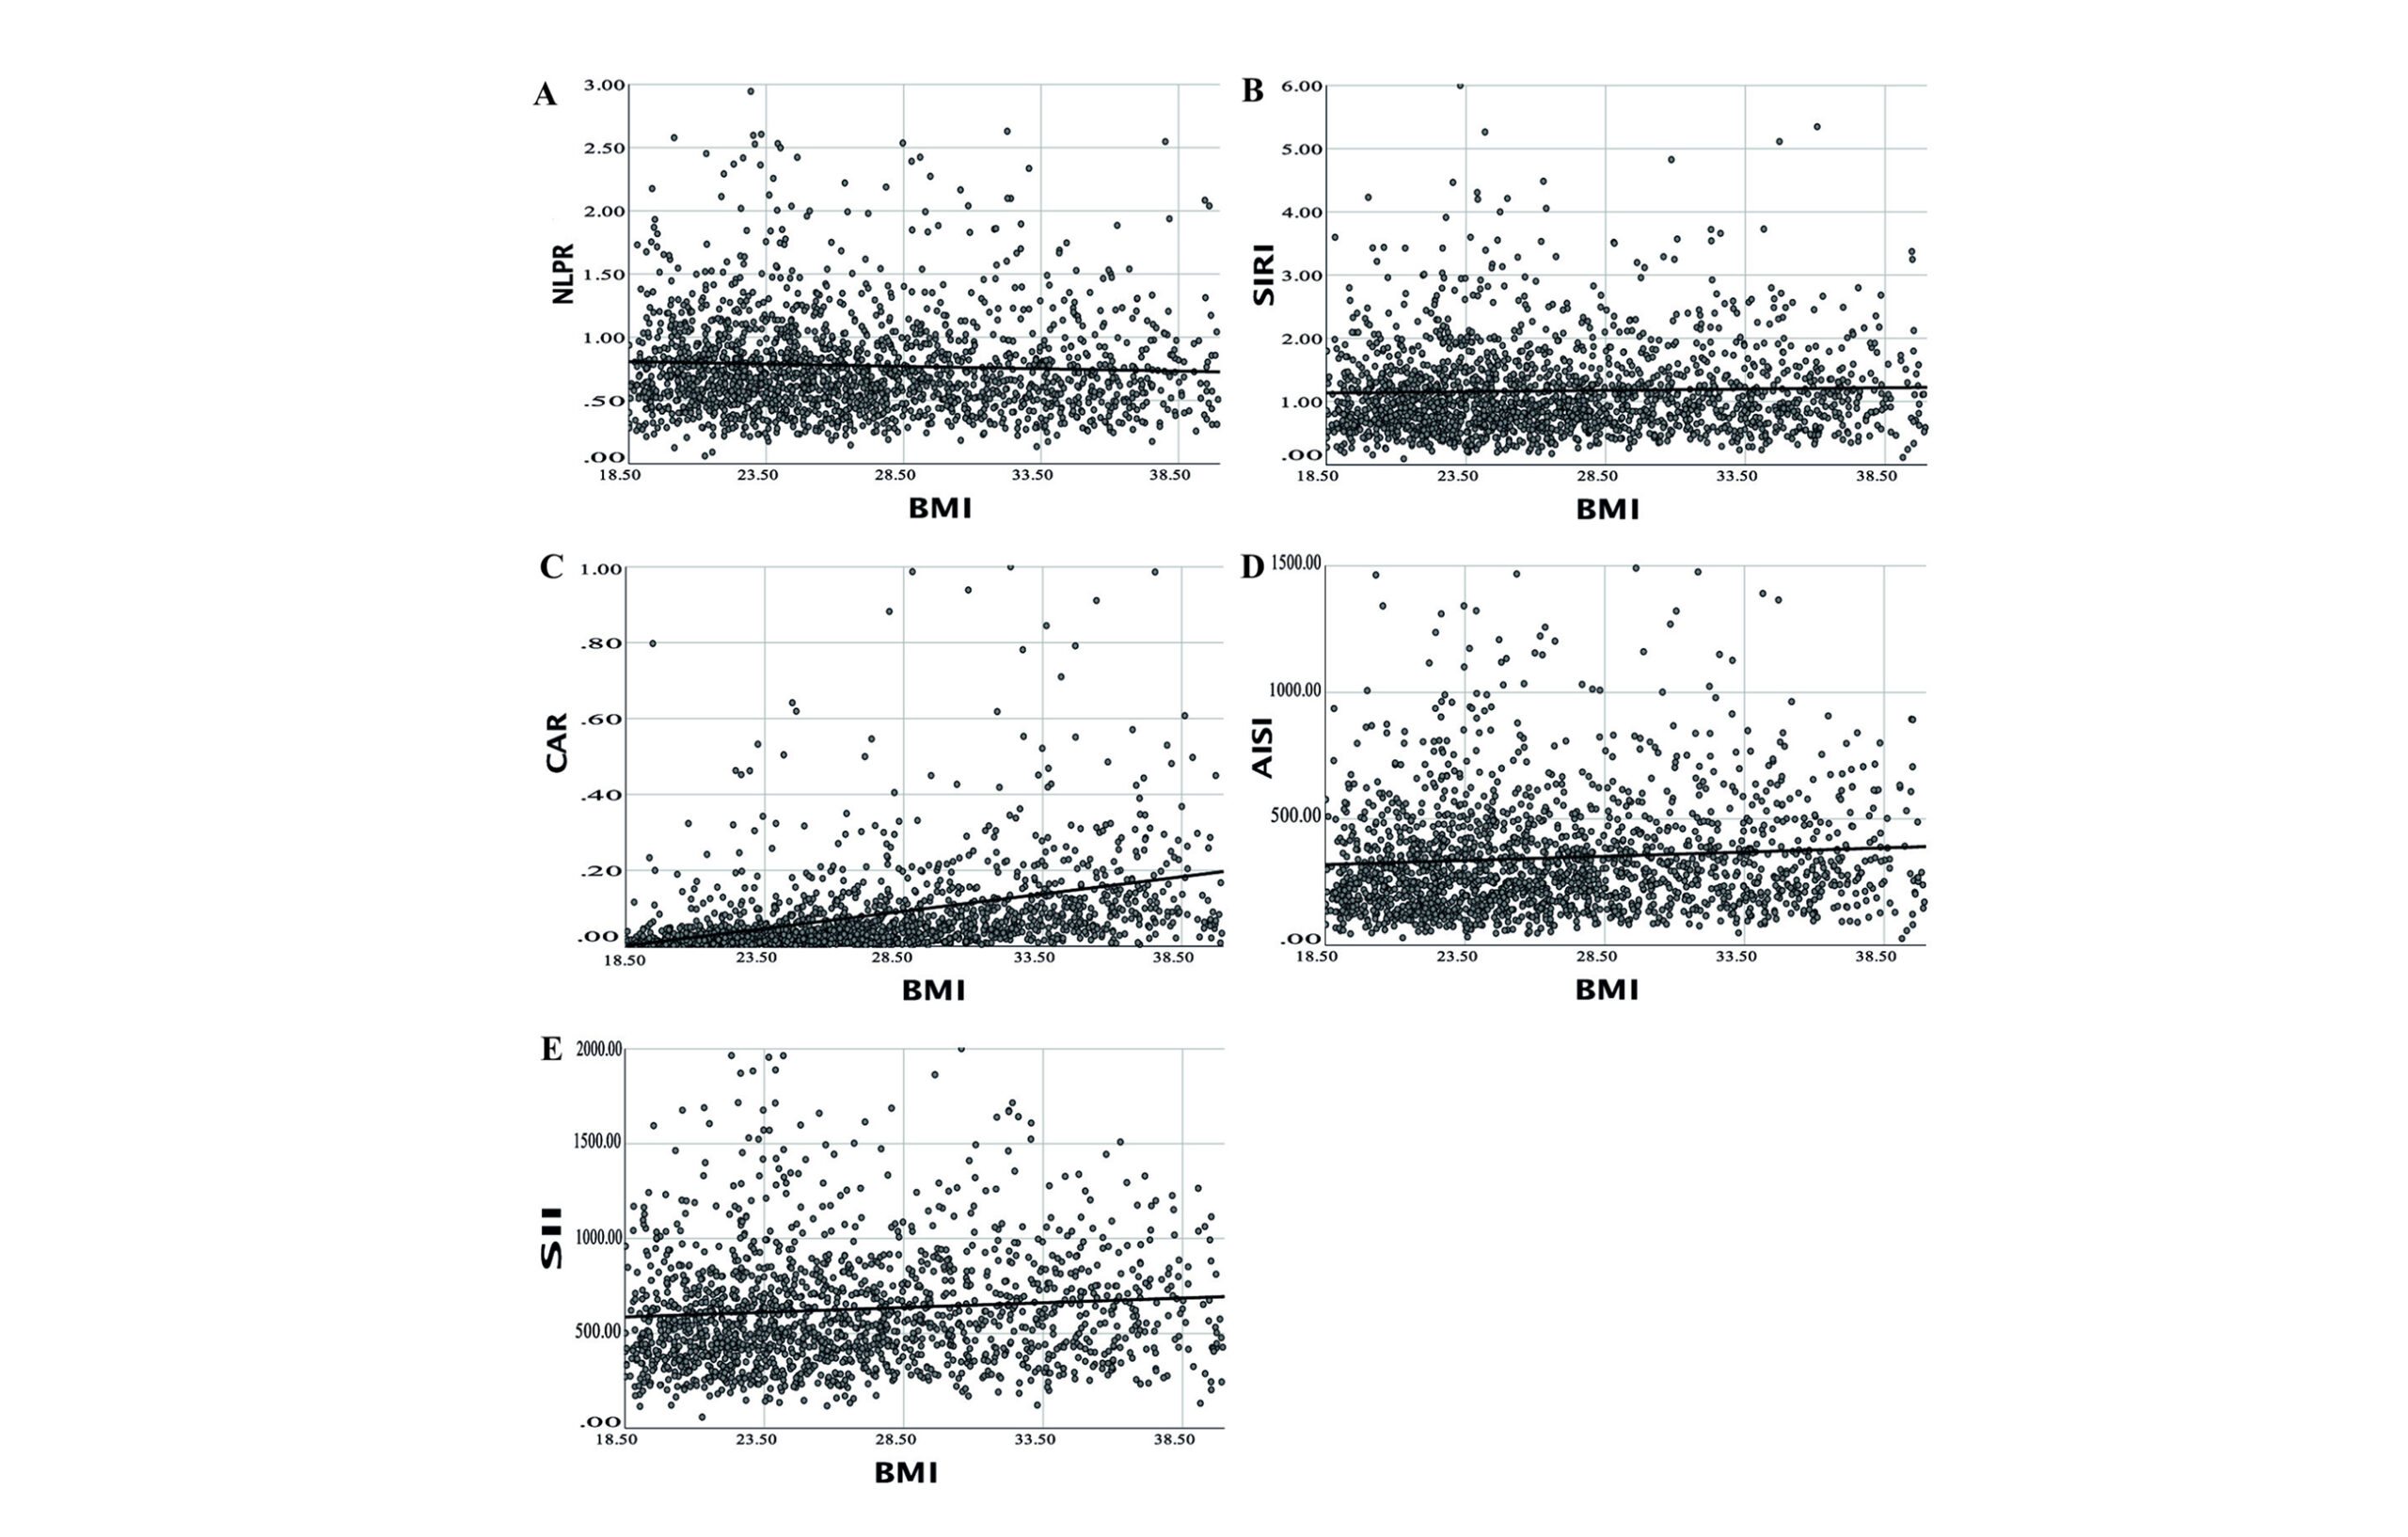
Figure 1: BMI is correlated with Systemic Inflammation indices. BMI was plotted against A) Neutrophil to platelet and lymphocyte ratio (NLPR), B) Systemic Inflammation Response index (SIRI), C) C-reactive protein to albumin ratio (CAR), D) Aggregate Index of Systemic Inflammation (AISI), and E) Systemic Immune-Inflammation index (SII). The black line corresponds to the linear fit.
Inflammation indices fluctuate during the menstrual cycle
To verify that the model was predictive, the well-characterized hormones, LH and FSH, that oscillate during the menstrual cycle were examined (Figure 2). As expected, LH and FSH presented a significant rhythm, as confirmed with the zero-amplitude test (p<0.05). A significant MESOR and amplitude were observed, and the cosine fit conformed to the expected cycle, suggesting that the cohort represents a typical menstrual cycle.
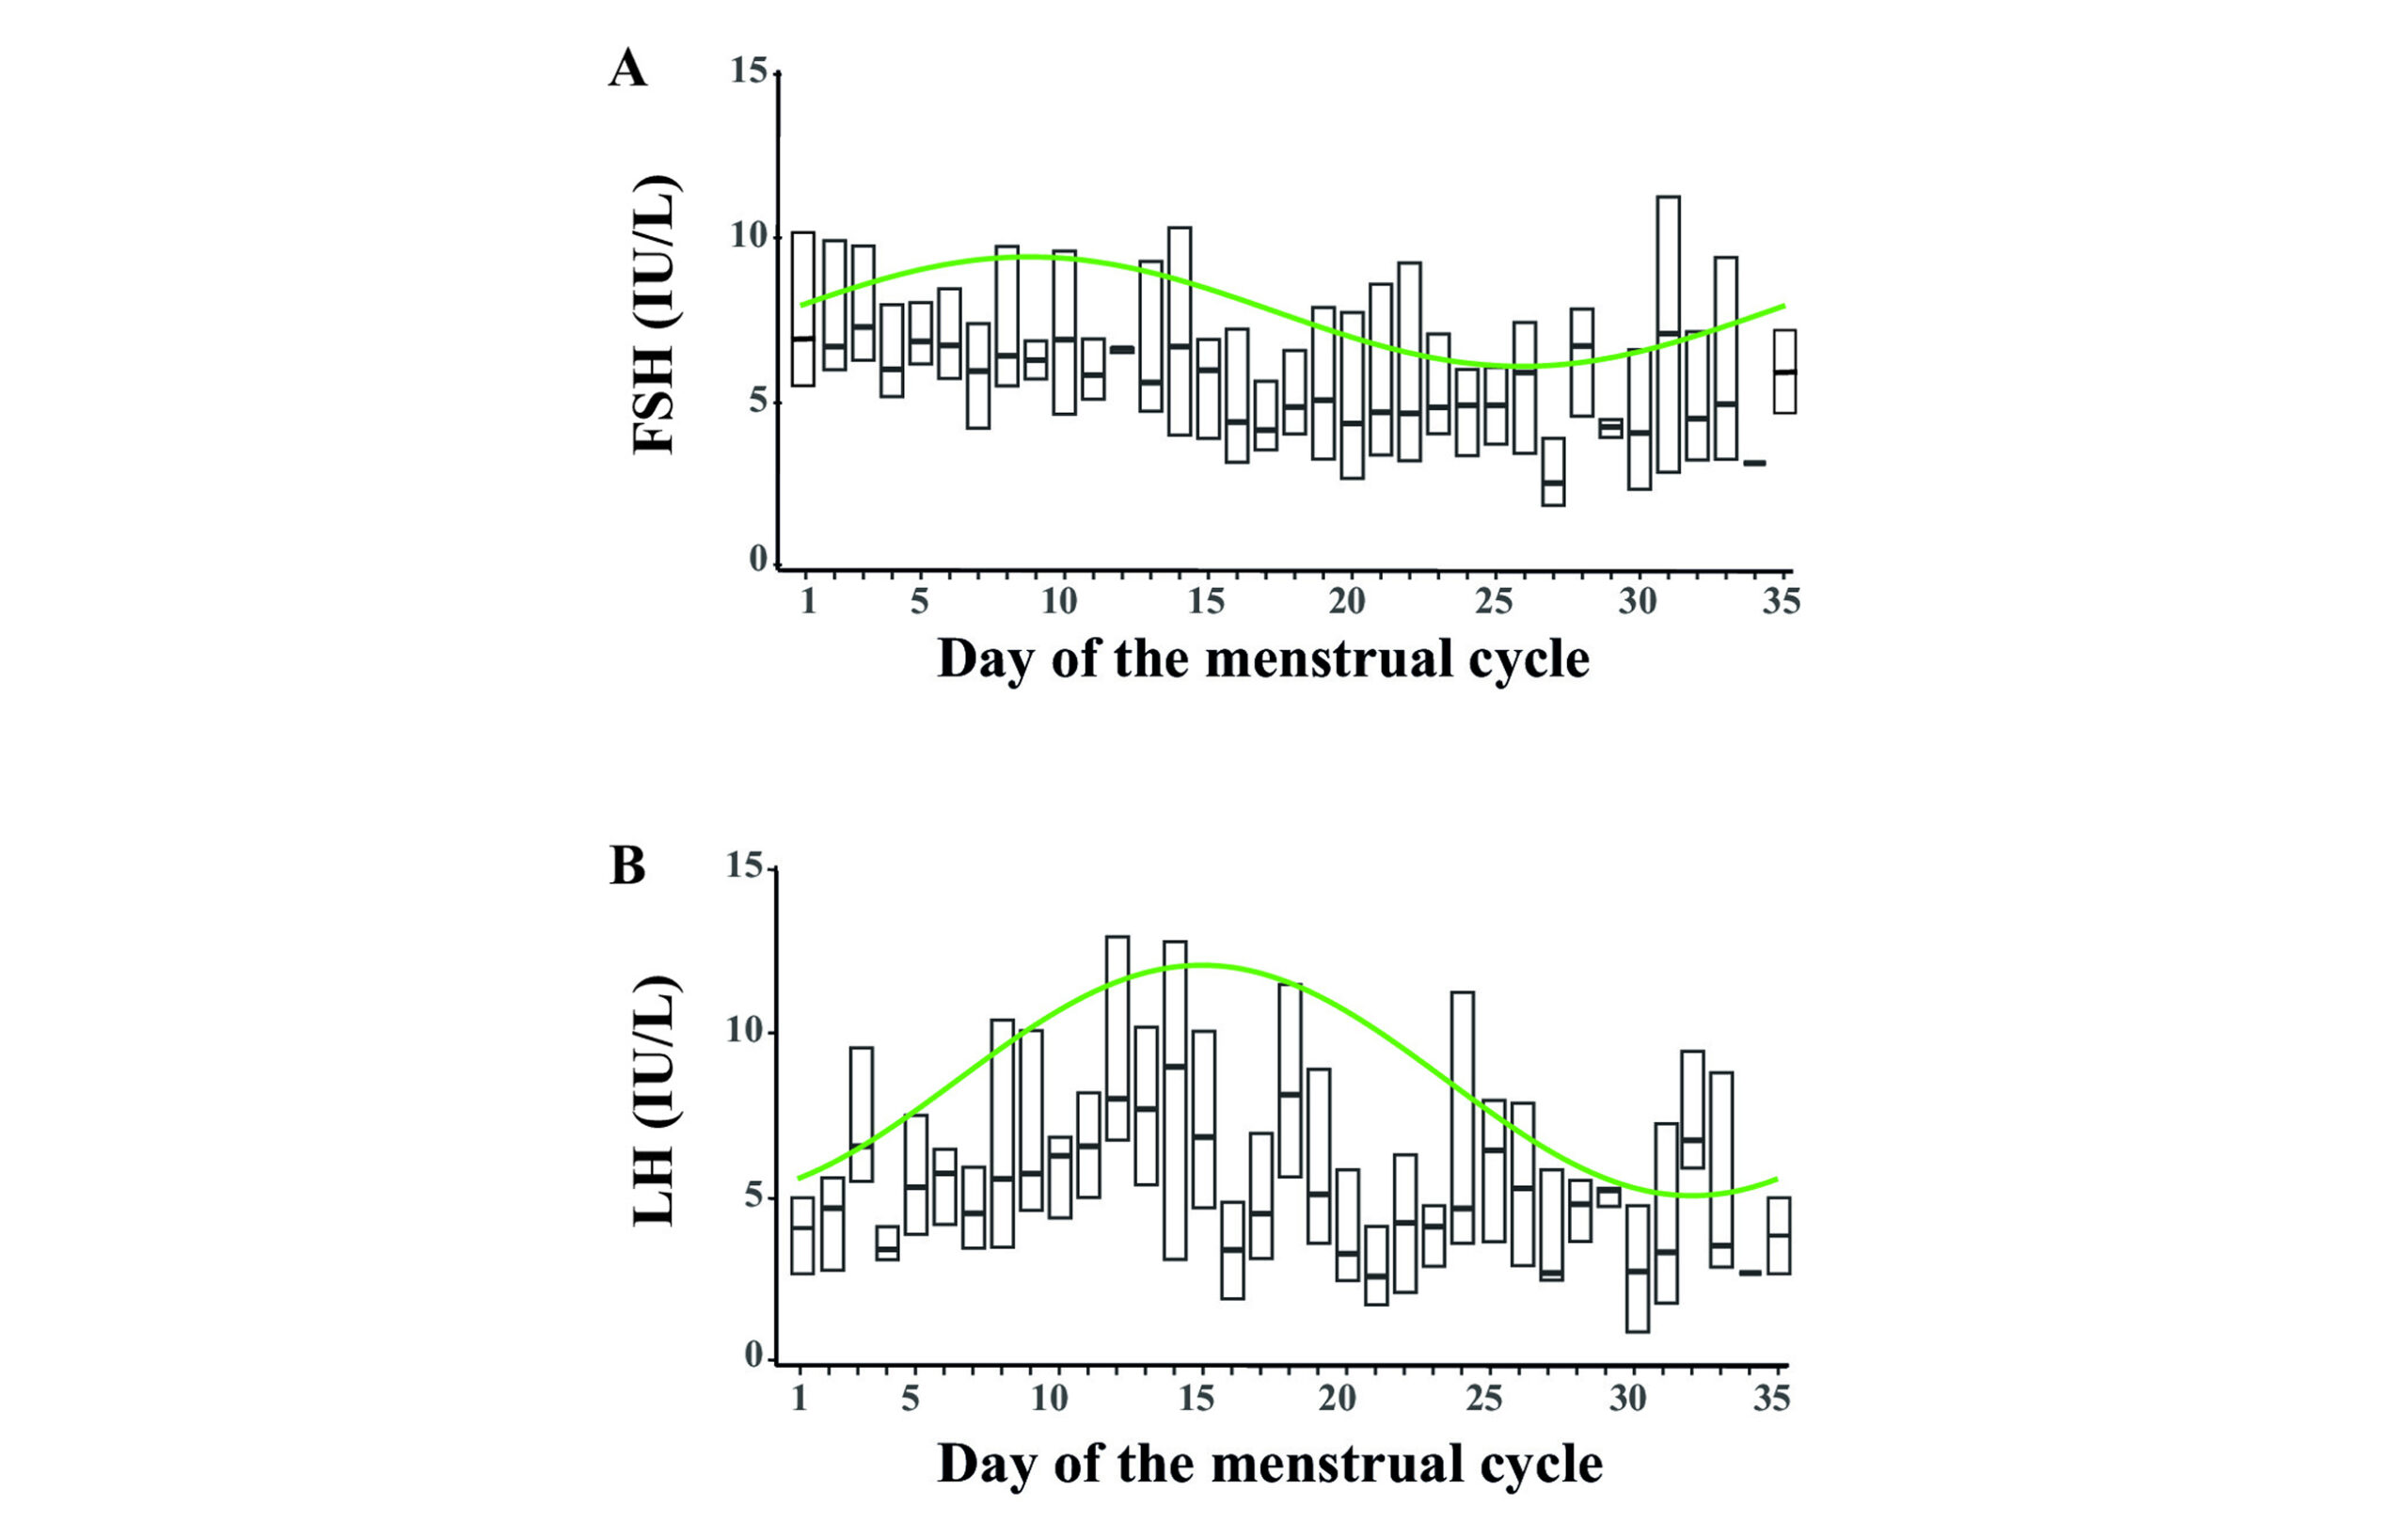
Figure 2: Follicle-stimulating hormone (FSH) and Luteinizing hormone (LH) fluctuate as expected due to the menstrual cycle. Cosinor model fits were constructed (green line) for fluctuations of A) FSH and B) LH by the menstrual cycle day. Box plots are shown for each day with median (line) and inter-quartile range (boxes) only shown.
NLRP Index
Overall, the NLPR index fluctuated during the menstrual cycle (p=0.004, Table 4 and Figure 3). With respect to OB, both groups presented with significant MESORS (p<0.001) that, when compared, were different (pMESOR=0.008); however, the difference was not large (0.06-fold decrease). Both groups had real amplitudes (p<0.05), in which the amplitudes were similar (pAMP=0.853). Interestingly, even though both groups had maximum points that were shifted from Day 1 (p<0.05), according to the acrophases, they were different (pACR<0.001). The maximal day for participants with NW occurred around Day 22-23, and for participants with OW/OB around Day 28-29.
| Group | MESOR a | Amplitude a | Acrophase a | pZero-amp b |
| NLPR | ||||
| Overall | 0.78 (0.76 – 0.80), <0.001* | 0.05 (0.02 – 0.07), 0.001* | 1.53 (0.92 – 2.13), <0.001* | 0.004 |
| Normal weight | 0.81 (0.78 – 0.84), <0.001* | 0.05 (0.01 – 0.09), 0.014* | 0.99 (0.08 – 1.89), 0.032* | <0.001 |
| Overweight | 0.76 (0.69 – 0.83), <0.001* | 0.05 (0.01 – 0.09), 0.007* | -1.21 (-1.88 – -0.54), <0.001* | |
| pMESOR c = 0.008 | pAMP d = 0.853 | pACR e = <0.001 | ||
| SIRI | ||||
| Overall | 1.18 (1.14 – 1.22), <0.001* | 0.08 (0.03 – 0.13), 0.001* | 1.28 (0.64 – 1.92), <0.001* | 0.004 |
| Normal weight | 1.18 (1.12 – 1.23), <0.001* | 0.09 (0.02 – 0.17), 0.011* | 0.73 (-0.14 – 1.59), 0.098 | 0.001 |
| Overweight | 1.18 (1.05 – 1.31), <0.001* | 0.10 (0.03 – 0.17), 0.007* | -1.43 (-2.15 – -0.72), <0.001* | |
| pMESOR c = 0.950 | pAMP d = 0.973 | pACR e <0.001 | ||
| CAR | ||||
| Overall | 0.079 (0.071 – 0.087), <0.001* | 0.013 (0.002 – 0.024), 0.021* | -0.18 (-0.97 – 0.62), 0.660 | 0.067 |
| Normal weight | 0.035 (0.024 – 0.046), <0.001* | 0.012 (-0.003 – 0.027), 0.113 | 0.60 (-0.77 – 1.97), 0.389 | <0.001 |
| Overweight | 0.114 (0.088 – 0.140), <0.001* | 0.017 (0.002 – 0.032), 0.022* | -0.70 (-1.45 – 0.06), 0.070 | |
| pMESOR c <0.001 | pAMP d = 0.618 | pACR e = 0.103 | ||
| AISI | ||||
| Overall | 348 (335 – 360), <0.001* | 18 (2 – 34), 0.029* | 1.14 (0.14 – 2.13), 0.026* | 0.091 |
| Normal weight | 336 (318 – 354), <0.001* | 21 (-5 – 46), 0.112 | 0.16 (-1.08 – 1.40), 0.796 | 0.008* |
| Overweight | 357 (314 – 400), <0.001* | 28 (5 – 51), 0.019* | -1.49 (-2.32 – -0.66), <0.001 | |
| pMESOR c = 0.098 | pAMP d = 0.689 | pACR e = 0.030 | ||
| SII | ||||
| Overall | 628 (611-644), <0.001* | 10 (-13 – 33), 0.399 | 0.29 (-2.14 – 2.72), 0.817 | 0.697 |
| Normal weight | 606 (581 – 631), <0.001* | 43 (7 – 80), 0.020* | -0.80 (-1.55 – -0.05), 0.037* | 0.002* |
| Overweight | 646 (588- 704), <0.001* | 32 (0 – 64), 0.047* | -1.36 (-2.30 – -0.41), 0.005* | |
| pMESOR c = 0.020* | pAMP d = 0.656 | pACR e = 0.366 |
Table 4: Fluctuations in the Systemic Inflammation indices during the menstrual cycle, stratified into normal weight and overweight/obese and young and old participants
Abbreviations: AISI: Aggregate Index of Systemic Inflammation; CAR: C-reactive protein to albumin ratio; MESOR: Midline Estimating Statistic of Rhythm; NLPR: neutrophil to platelet and lymphocyte ratio; SII: Systemic Immune-Inflammation index; SIRI: Systemic inflammation response index.
a MESOR, amplitude, and acrophase were determined using the Cosinor and Cosinor2 packages for R. Values are estimated (95% confidence interval), and p-values.
The p-value was calculated using the cosinor. detect function of the Cosinor2 package, which detects rhythm (also called the zero-amplitude test) and tests the overall significance of the cosinor model.
c p-value is for the difference in MESORS and was calculated using the summary function of the Cosinor package. The result assessed the difference between the second category and the primary category.
d p-value is for the difference in amplitude and was calculated using the test_cosinor function of the Cosinor package.
e p-value is for the difference in acrophase and was calculated using the test_cosinor function of the Cosinor package.
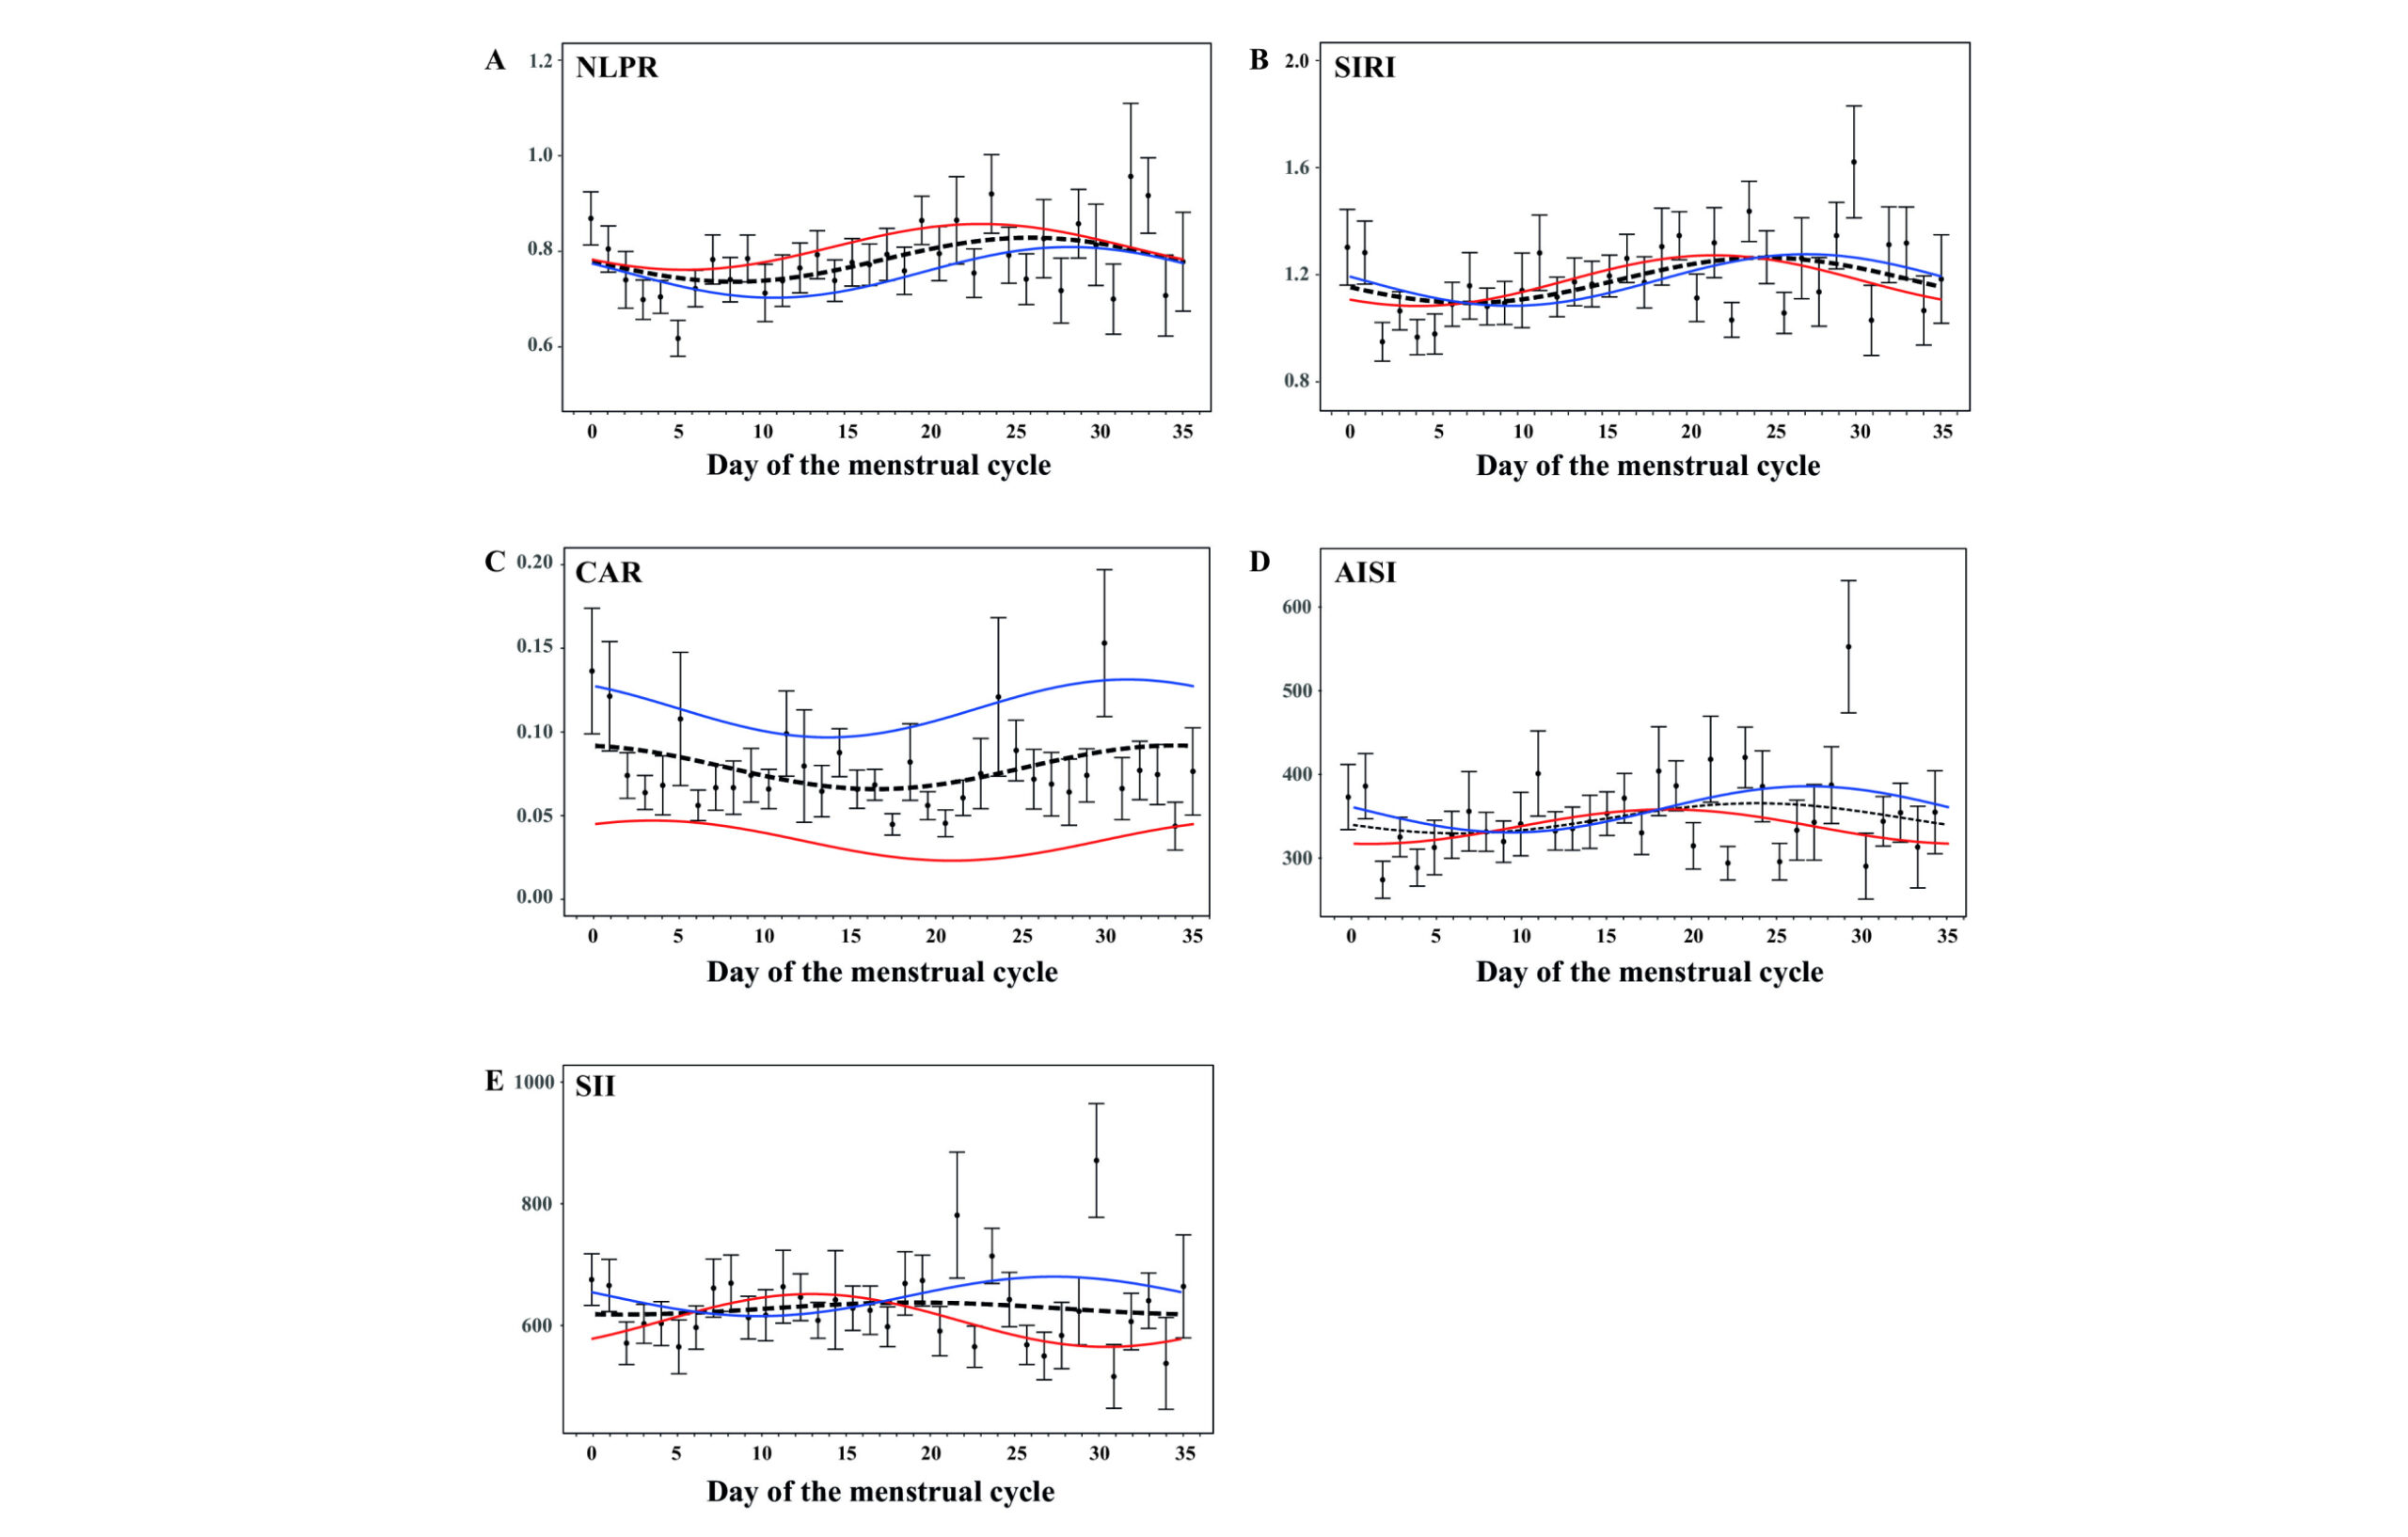
Figure 3: Systemic inflammation fluctuates during the menstrual cycle, which is affected by OB. Means (dots) and standard error (bars) plots with cosine waves were constructed to demonstrate the changes for AISI (A), CAR (B), NLPR (C), SII (D) and SIRI (E) during the menstrual cycle. Cosinor model fits are shown for all participants (black line), for participants with NW (red line), and for participants with OW/OB (blue line)
SIRI Index
For the total cohort, the SIRI index demonstrated a fluctuation (p=0.004) that remained when stratified by BMI (p=0.001). Participants with NW and participants with OW/OB had similar significant MESORs (pMESOR=0.950) and amplitudes (pAMP=0.973). However, participants with OW/OB had a shift when the maximum would occur, which was different from participants with NW (pACR<0.001). The maximal day for the participants with NW occurred around Day 21-22, and for participants with OW/OB around Day 27-29.
CAR Index
Overall, the CAR index had a significant MESOR and amplitude, but the zero-amplitude test indicated that the effect may be an artifact (p=0.067). Concerning OB, participants with NW had a significant MESOR (p<0.001) but did not present a cosine curve. For participants with OB/OW, the MESOR (p<0.001) was also significant and was 2.3-fold larger than that of participants with NW (p<0.001). Interestingly, participants with OW/OB presented with a significant amplitude (p=0.022) that was not out of phase (p=0.070). The maximal day for participants with OW/OB occurred at the end of the cycle.
AISI Index
For the AISI index, initially, a Cosinor curve could not be fitted (pzero-amplitude=0.091), even though a rhythm was observed (amplitude: p=0.029; acrophase: p=0.026). Nevertheless, when stratified by BMI, only for participants with OW/OB did the COSINOR fit a curve. The amplitudes and acrophases were significant for participants with OW/OB (p<0.05), suggesting a maximum occurring around Day 26-28.
SII Index
Overall, the SII index was not shown to fluctuate during the menstrual cycle; however, when the cohort was stratified by OB, both groups presented with significant MESORS (p<0.001), amplitudes (p<0.05), and acrophases (p<0.05). Interestingly, the MESORs were significantly different (pMESOR=0.020), but not the amplitudes nor the acrophases.
Discussion
Our study demonstrated that indices associated with systemic inflammation fluctuate during the menstrual cycle. Moreover, when OB was considered, there were significant differences in physiological inflammation between participants with NW and participants with OW/OB.
The NLPR, SIRI, AISI, and SII indices consist of immune cells (neutrophils, lymphocytes, monocytes, and platelets), whereas the CAR index contains inflammation-regulating factors (CRP and albumin). Each of these biomarkers is an indicator of inflammation and promotes normal function during the menstrual cycle, especially in participants with NW.[12] However, with OB, these biomarkers increase.[12-14] Therefore, it was expected that changes in the numbers of these would occur.
Cells would be observed. Indeed, neutrophils, lymphocytes, monocytes, platelets, CRP, and albumin were elevated in participants with OW/OB. This resulted in the SII, AISI, and CAR indices being associated with BMI increases. Nevertheless, these effects are the summation of many participants, independent of their menstrual day, and the effect of BMI on the physiology of the menstrual cycle is masked.
How immune cells fluctuate during the menstrual cycle: Menstruation is a non-pathological inflammatory process accompanied by tissue degradation and bleeding at the end of each normal menstrual cycle. Deprivation of progesterone and estrogen during the cycle causes a decrease in prostaglandin metabolism and a loss of defense against reactive oxygen species. Increased reactive oxygen species cause the induction of inflammatory signals and the release of proinflammatory mediators with the recruitment of immune cells.[20] It is assumed that in the menstrual cycle, in the follicular phase, estrogens exert more anti-inflammatory effects, while during the luteal phase, estrogens exert more pro-inflammatory effects.[21] Therefore, it was expected that specific immune cells would fluctuate during the cycle, as well as their respective inflammation indices. This was observed in all indices (black lines).
For their part, neutrophils are barely detectable in the endometrium during most of the menstrual cycle. Still, their number escalates just before the start of menstruation, representing 6 to 15% of the total white blood cells in the tissue. This was observed with NLPR, SIRI, and AISI indices. This is because neutrophils contain high levels of matrix metalloproteinases and can activate matrix metalloproteinases in situ, leading to endometrial rupture during menstruation.20 However, neutrophils contribute to endometrial function not only in degradation but also in restoring the endometrium. Endometrial neutrophils secrete interferon-γ, vascular endothelial growth factor, and interleukin-17, which participate in cell proliferation, angiogenesis, and the immune response, all of which are necessary for implantation and maintenance of a pregnancy.[20,22]
Lymphocytes have been reported during the luteal phase of the menstrual cycle to express the LH receptor, indicating that peripheral blood lymphocytes are directly activated during the LH surge (Days 12 to 13).[23] Lymphocytes reach their maximum point of activity during menstruation.24 Here, AISI, NLPR, and SIRI indices suggest this occurs when their inputs (monocytes, neutrophils, and platelets) are considered. Monocytes were observed to increase and reach their maximum in the luteal phase. They are activated by estrogen and progesterone due to the estrogen-specific surface receptors. These immune cells are potentially susceptible to cyclic changes in circulating hormone concentrations, with the lowest monocyte activity observed within the follicular phase of the menstrual cycle and found to be increased during the luteal phase.[21,24,25] The monocyte-containing indices (AISI and SIRI) demonstrate this effect. With respect to platelets, as expected, the AISI, SIRI, and SII indices showed an increase at the end of the second half of the cycle. This is due to endometrial hemostasis achieved through platelet aggregation, fibrin deposition, and thrombus formation that interact with local endocrine and immunological factors associated with menstrual bleeding.[26]
A non-immune cell marker of inflammation, CRP is controversial regarding its activity during the menstrual cycle, due to hormonal influence. Studies have proposed that CRP does not show differences between the follicular and luteal phases.[21] However, it has also been demonstrated that CRP is inversely associated with estradiol throughout the menstrual cycle and is positively associated with luteal progesterone levels. These support the possibility that endogenous estrogens may act as anti-inflammatory agents.[27] Here, the CAR index profile during the menstrual cycle supports the latter mechanism, in which CAR levels increased once the follicular phase ended. Additionally, albumin concentrations significantly increased in the luteal phase compared to the follicular phase, also supporting the CAR index increase during the luteal phase.[28]
OB affects the menstrual cycle fluctuations of inflammation: It is necessary for the menstrual cycle to maintain homeostasis of immune cells and inflammation, controlled by the appropriate hormonal levels of the female sexual axis, for proper growth, maintenance, and shedding of the endometrium. However, this balance can be affected by modifiable factors, such as OB. OB is associated with increased menstrual cycle irregularity and/or polycystic ovary syndrome, which can cause infrequent or absent menstrual periods and heavy menstrual bleeding.[29] Previous studies evaluating the impact of OB on endometrial function have focused primarily on endometrial cancer or implantation during assisted reproduction.[30] However, to our knowledge, no studies have focused on the effect of OB on inflammation during the menstrual cycle.
During OB, stressed adipocytes produce adipokines, which recruit and activate innate immune cells. Furuncuoğlu et al. demonstrated that an increase in BMI leads to an increase in neutrophils, lymphocytes, and leukocytes.[14] Here, there were higher levels of these inflammatory cells with increased BMI. This was confirmed with the different MESORs for the SII and the NLPR indices. However, the cosinor curves for participants with NW and for participants with OW/OB were similar for all indices with respect to their amplitudes. This suggests that the effect caused by OB does not affect the overall fluctuation of inflammation during the menstrual cycle. However, significant differences existed between the wave’s crest for participants with NW and for participants with OW/OB, as shown by the NLPR, SIRI, and AISI indices. OB is associated with an increased prevalence of infertility and menstrual problems, which this phenomenon could explain.[29]
Lastly, as an acute-phase reactant of inflammation and infection, CRP is a factor associated with OB.[31,32] Higher BMIs are associated with higher CRP concentrations. These findings indicate a low-grade systemic inflammation among people with OW/OB.[33] In individuals with severe OB, there is a greater probability of hypoalbuminemia because OB reflects malnutrition and deficiency of various nutritional factors, including antioxidants.[34] These factors of OB could cause hypoalbuminemia since albumin decreases with chronic inflammation and malnutrition.[35] This effect was observed here. Due to the intricate involvement of inflammation from both the immune cells and inflammatory biomarkers, it is posited that CRP and hypoalbuminemia could be a factor for infertility. As seen with the CAR index, OB increases inflammation to a potentially high level.
Limitations: Our study has a few limitations. First, pathologies that could affect the count and quality of immune cells and inflammatory markers were not evaluated, such as certain autoimmune diseases (LUPUS, Guillain-Barré syndrome, rheumatoid arthritis, multiple sclerosis) and hematological diseases (thrombocytopenia, multiple myeloma, leukemias, bone marrow aplasia). Second, participants taking certain immunosuppressive medications, such as steroids (prednisone, methylprednisolone, dexamethasone), antimalarials (hydroxychloroquine), or antimetabolites (methotrexate), were not excluded. These potential pharmacodynamic effects must be considered and evaluated in future studies. Third, the results shown here were not adjusted. Neutrophils, lymphocytes, monocytes, platelets, CRP, and albumin can be affected by stress, diet, exercise, and lifestyle, and all of these factors should be considered in future studies.
Conclusion
Inflammation, as measured by the NLPR, SIRI, CAR, AISI, and SII indices, during the menstrual cycle has periodicity. However, OB affects the overall midline of inflammation and the time at which the peak is achieved. This may represent alterations in the menstrual cycle and, subsequently, impact biological female reproduction.
References
- Harris BS, Steiner AZ, Faurot KR, Long A, Jukic AM. Systemic inflammation and menstrual cycle length in a prospective cohort study. Am J Obstet Gynecol. 2023;228(2):215.e1-215.e17. doi:10.1016/j.ajog.2022.10.008 PubMed | Crossref | Google Scholar
- Chen L, Deng H, Cui H, et al. Inflammatory responses and inflammation-associated diseases in organs. Oncotarget. 2017;9(6):7204-7218. doi:10.18632/oncotarget.23208 PubMed | Crossref | Google Scholar
- Kotas ME, Medzhitov R. Homeostasis, inflammation, and disease susceptibility. Cell. 2015;160(5):816-827. doi:10.1016/j.cell.2015.02.010 PubMed | Crossref | Google Scholar
- Scheiermann C, Kunisaki Y, Frenette PS. Circadian control of the immune system. Nat Rev Immunol. 2013;13(3):190-198. doi:10.1038/nri3386 PubMed | Crossref | Google Scholar
- Lorenz TK. Interactions between inflammation and female sexual desire and arousal function. Curr Sex Health Rep. 2019;11(4):287-299. doi:10.1007/s11930-019-00218-7 PubMed | Crossref | Google Scholar
- Clancy KB, Baerwald AR, Pierson RA. Systemic inflammation is associated with ovarian follicular dynamics during the human menstrual cycle. PLoS One. 2013;8(5):e64807. doi:10.1371/journal.pone.0064807 PubMed | Crossref | Google Scholar
- Weiss G, Goldsmith LT, Taylor RN, Bellet D, Taylor HS. Inflammation in reproductive disorders. Reprod Sci. 2009;16(2):216-229. doi:10.1177/1933719108330087 PubMed | Crossref | Google Scholar
- Yazaki LG, Faria JCP, Souza FIS, Sarni ROS. Neutrophil-to-lymphocyte and platelet-to-lymphocyte ratios of overweight children and adolescents. Rev Assoc Med Bras (1992). 2022;68(8):1006-1010. doi:10.1590/1806-9282.20211253 PubMed | Crossref | Google Scholar
- Ellulu MS, Samouda H. Clinical and biological risk factors associated with inflammation in patients with type 2 diabetes mellitus. BMC Endocr Disord. 2022;22(1):16. doi:10.1186/s12902-021-00925-0 PubMed | Crossref | Google Scholar
- Lin X, Li H. Obesity: Epidemiology, Pathophysiology, and Therapeutics. Front Endocrinol (Lausanne). 2021;12:706978. doi:10.3389/fendo.2021.706978 PubMed | Crossref | Google Scholar
- Silvestris E, de Pergola G, Rosania R, Loverro G. Obesity as disruptor of the female fertility. Reprod Biol Endocrinol. 2018;16(1):22. doi:10.1186/s12958-018-0336-z PubMed | Crossref | Google Scholar
- Rodríguez-Rodríguez E, Salas-González MD, Ortega RM, López-Sobaler AM. Leukocytes and Neutrophil-Lymphocyte Ratio as Indicators of Insulin Resistance in Overweight/Obese School-Children. Front Nutr. 2022;8:811081. doi:10.3389/fnut.2021.811081 PubMed | Crossref | Google Scholar
- Aydin M, Yilmaz A, Donma MM, et al. Neutrophil/lymphocyte ratio in obese adolescents. North Clin Istanb. 2015;2(2):87-91. doi:10.14744/nci.2015.25238 PubMed | Crossref | Google Scholar
- Furuncuoğlu Y, Tulgar S, Dogan AN, Cakar S, Tulgar YK, Cakiroglu B. How obesity affects the neutrophil/lymphocyte and platelet/lymphocyte ratio, systemic immune-inflammatory index and platelet indices: a retrospective study. Eur Rev Med Pharmacol Sci. 2016;20(7):1300-1306. How obesity affects the neutrophil/lymphocyte and platelet/lymphocyte ratio, systemic immune-inflam…
- Ghobadi H, Mohammadshahi J, Javaheri N, Fouladi N, Mirzazadeh Y, Aslani MR. Role of leukocytes and systemic inflammation indexes (NLR, PLR, MLP, dNLR, NLPR, AISI, SIR-I, and SII) on admission predicts in-hospital mortality in non-elderly and elderly COVID-19 patients. Front Med (Lausanne). 2022;9:916453. doi:10.3389/fmed.2022.916453 PubMed | Crossref | Google Scholar
- Dang H, Mao W, Wang S, et al. Systemic inflammation response index as a prognostic predictor in patients with acute ischemic stroke: A propensity score matching analysis. Front Neurol. 2023;13:1049241. doi:10.3389/fneur.2022.1049241 PubMed | Crossref | Google Scholar
- Zinellu A, Collu C, Nasser M, et al. The Aggregate Index of Systemic Inflammation (AISI): A Novel Prognostic Biomarker in Idiopathic Pulmonary Fibrosis. J Clin Med. 2021;10(18):4134. doi:10.3390/jcm10184134 PubMed | Crossref | Google Scholar
- Li C, Tian W, Zhao F, et al. Systemic immune-inflammation index, SII, for prognosis of elderly patients with newly diagnosed tumors. Oncotarget. 2018;9(82):35293-35299. doi:10.18632/oncotarget.24293 PubMed | Crossref | Google Scholar
- Hernández-Melchor D, Carrillo H, Rivera AM, et al. Obesity attenuates the beneficial effect of an intrauterine infusion of autologous platelet-rich plasma during in vitro fertilization. Am J Transl Res. 2024;16(3):838-854. doi:10.62347/RDXA5841 PubMed | Crossref | Google Scholar
- Jia L, Du Y, Chu L, et al. Prevalence, risk factors, and management of dementia and mild cognitive impairment in adults aged 60 years or older in China: a cross-sectional study. Lancet Public Health. 2020;5(12):e661-e671. doi:10.1016/S2468-2667(20)30185-7 PubMed | Crossref | Google Scholar
- Notbohm HL, Moser F, Goh J, Feuerbacher JF, Bloch W, Schumann M. The effects of menstrual cycle phases on immune function and inflammation at rest and after acute exercise: A systematic review and meta-analysis. Acta Physiol (Oxf). 2023;238(4):e14013. doi:10.1111/apha.14013 PubMed | Crossref | Google Scholar
- Mueller MD, Lebovic DI, Garrett E, Taylor RN. Neutrophils infiltrating the endometrium express vascular endothelial growth factor: potential role in endometrial angiogenesis. Fertil Steril. 2000;74(1):107-112. doi:10.1016/s0015-0282(00)00555-0 PubMed | Crossref | Google Scholar
- van den Heuvel MJ, Horrocks J, Bashar S, et al. Menstrual cycle hormones induce changes in functional interactions between lymphocytes and decidual vascular endothelial cells. J Clin Endocrinol Metab. 2005;90(5):2835-2842. doi:10.1210/jc.2004-1742 PubMed | Crossref | Google Scholar
- Sikora J, Mielczarek-Palacz A, Kondera-Anasz Z, Strzelczyk J. Peripheral blood proinflammatory response in women during menstrual cycle and endometriosis. Cytokine. 2015;76(2):117-122. doi:10.1016/j.cyto.2015.08.007 PubMed | Crossref | Google Scholar
- Willis C, Morris JM, Danis V, Gallery ED. Cytokine production by peripheral blood monocytes during the normal human ovulatory menstrual cycle. Hum Reprod. 2003;18(6):1173-1178. doi:10.1093/humrep/deg231 PubMed | Crossref | Google Scholar
- Alzahrani F, Hassan F. Modulation of Platelet Functions Assessment during Menstruation and Ovulatory Phases. J Med Life. 2019;12(3):296-300. doi:10.25122/jml-2019-0005 PubMed | Crossref | Google Scholar
- Gaskins AJ, Wilchesky M, Mumford SL, et al. Endogenous reproductive hormones and C-reactive protein across the menstrual cycle: the BioCycle Study. Am J Epidemiol. 2012;175(5):423-431. doi:10.1093/aje/kwr343 PubMed | Crossref | Google Scholar
- Adias TC, Erhabor O, Shehu SA, Erhabor T. Menstrual cycle-associated effects on some acute phase reactants parameters of Students in Usmanu Danfodiyo University Sokoto, North Western Nigeria. Hum Antibodies. 2019;27(4):291-298. doi:10.3233/HAB-190386 PubMed | Crossref | Google Scholar
- Fielder S, Nickkho-Amiry M, Seif MW. Obesity and menstrual disorders. Best Pract Res Clin Obstet Gynaecol. 2023;89:102343. doi:10.1016/j.bpobgyn.2023.102343 PubMed | Crossref | Google Scholar
- Reavey JJ, Walker C, Murray AA, et al. Obesity is associated with heavy menstruation that may be due to delayed endometrial repair. J Endocrinol. 2021;249(2):71-82. doi:10.1530/JOE-20-0446 PubMed | Crossref | Google Scholar
- Li Q, Wang Q, Xu W, et al. C-Reactive Protein Causes Adult-Onset Obesity Through Chronic Inflammatory Mechanism. Front Cell Dev Biol. 2020;8:18. doi:10.3389/fcell.2020.00018 PubMed | Crossref | Google Scholar
- Uribe-Querol E, Rosales C. Neutrophils Actively Contribute to Obesity-Associated Inflammation and Pathological Complications. Cells. 2022;11(12):1883. doi:10.3390/cells11121883 PubMed | Crossref | Google Scholar
- Visser M, Bouter LM, McQuillan GM, Wener MH, Harris TB. Elevated C-reactive protein levels in overweight and obese adults. JAMA. 1999;282(22):2131-2135. doi:10.1001/jama.282.22.2131 PubMed | Crossref | Google Scholar
- Mosli RH, Mosli HH. Obesity and morbid obesity associated with higher odds of hypoalbuminemia in adults without liver disease or renal failure. Diabetes Metab Syndr Obes. 2017;10:467-472. doi:10.2147/DMSO.S149832 PubMed | Crossref | Google Scholar
- Mun KH. Association Between Serum Albumin Levels and Obesity and Risk of Developing Chronic Kidney Disease Using Data from the Korean Multi-Rural Communities Cohort (MRCohort) Population Database. Med Sci Monit. 2021;27:e933840. doi:10.12659/MSM.933840 PubMed | Crossref | Google Scholar
Acknowledgments
The authors would like to express their gratitude to Mr. Alfredo Avendaño Arenaza, Director of Biblioteca Central Universitaria, and Mtro. Ricardo Villegas Tovar, Coordinator of Scientific Production and International Visibility, at the Benemérita Universidad Autónoma de Puebla. The authors would also like to thank the participants and the NHANES staff for their valuable contributions.
Funding
This study was supported by grants from the Programa para el Desarrollo Profesional Docente (to CA-160 FACMED) and the Vicerrectorıa de Investigación, Benemerita Universidad Autonoma de Puebla, Mexico (to GOMM-SAL22-G). The funders had no role in the study’s design, data collection, or analysis, the decision to publish, or manuscript preparation.
Author Information
Corresponding Author:
Esther López-Bayghen
Department of Toxicology
Cinvestav-IPN, 2508 Instituto Politécnico Nacional Avenue, San Pedro Zacatenco Neighborhood, Mexico City, Federal District, Mexico
Email: ebayghen@cinvestav.mx
Co-Authors:
Priscila Mishelle Bartolo-Gomez, M. Elba Gonzalez-Mejia
Department of Genetics
Faculty of Medicine, Benemérita Autonomous University of Puebla, Puebla, Puebla, Mexico
Leonardo M. Porchia
Institute of Infertility and Genetics Mexico, S.C. (Ingenes), Mexico City, Mexico
Authors Contributions
PMBG was responsible for conceptualization, data curation, formal analysis, and writing-original draft. LMP was responsible for data curation, formal analysis, methodology, and writing-original draft. MEGM was responsible for conceptualization, formal analysis, funding, visualization, writing, review, and editing. ELB was responsible for project administration, methodology, writing, review, and editing. All authors have approved the final version of the manuscript.
Ethical Approval
The NCHS Research Ethics Review Board approved the NHANES study protocols (https://wwwn.cdc.gov/nchs/nhanes/default.aspx). The Centers for Disease Control and Prevention conducted the survey, and all participants reviewed and signed a comprehensive informed consent. As expected, all procedures followed were in accordance with the Helsinki Declaration of 1975, as revised in 2008.
Conflict of Interest Statement
The authors declare that they have no known competing financial interests or personal relationships that could have appeared to influence this work.
Guarantor
Esther López-Bayghen is the guarantor of this study and takes full responsibility for the integrity and accuracy of the data and the analysis.
DOI
Cite this Article
Bartolo-Gomez PM, Porchia LM, Gonzalez-Mejia ME, López-Bayghen E. Effect of Obesity on Inflammation Fluctuations During the Menstrual Cycle: An Analysis of the Cross-Sectional Study of NHANES. medtigo J Med. 2026;4(1):e3062414. doi:10.63096/medtigo3062414 Crossref