


 Author Affiliations
Abstract
Driven by technological advancements, the widespread use of screens in laptops, phones, and televisions (TVs) has become an essential aspect of daily life, particularly for university students. This study explored the relationship between screen time, sleep quality, and academic performance among Meru University of Science and Technology (MUST) students. The research investigated how prolonged screen exposure affects sleep patterns and academic outcomes, aiming to provide evidence-based insights for educators and policymakers. Data was collected using a mixed methods approach through surveys and interviews to assess screen time habits, sleep quality, and academic performance. Statistical analyses, including scatter plots, correlation matrices, and regression models, were employed to examine the associations between these variables. Findings revealed minimal correlations between screen time/light brightness and academic performance/sleep time. The R-squared values for the relationships between screen time and sleep time, screen time and academic performance, screen light and academic performance, and screen light and sleep time were notably low, ranging from 0.0006 to 0.0051, with one slightly higher at 0.182%. These findings suggest that other uncontrollable or unmeasured variables might play a more substantial role in these outcomes than the screen-related variables alone.
Keywords
Screen time, Sleep time, Academic performance, Screen light, Digital devices, Correlation analysis, Pearson correlation coefficient, Scatter plot, Insomnia, Sleep paralysis, Reduced cognitive function.
Introduction
Screen time is the measurement of hours spent using a device with a screen, for example, smartphones, computers, televisions, or video games. Using electronic media with a screen interface is exceedingly prevalent among the youth. However, the adult age group has enticingly materialized into spending more time on the screen via social media like TikTok and Instagram in their thirst for entertainment. According to a national survey on diffusion of technological devices, people between the ages of 18-24 years are high consumers of the internet, spending an average of 27 hours per week online. Students of higher learning institutions, including MUST, have high levels of screen exposure because of easy access to computers, laptops, and smartphones used for academic work, news, and leisure or entertainment. Using screens for prolonged hours, that is, beyond the recommended limit, can lead to poor performance and poor sleep quality. In the modern world, the availability of screens has become an integral part of daily life.[1]
The surge in screen time, propelled by technological advancements and the digitization of various aspects of society, raises concern about potential health consequences, particularly in relation to prolonged exposure and its impact on learning.[2] Disturbed sleep patterns, cognitive function, and reduced physical activity may contribute to obesity. Additionally, excessive screen time, especially before bedtime, may interfere with the body’s natural circadian rhythm due to interference with time for sleep.[3,4] Prolonged exposure to screens, whether from computers, smartphones, or other devices, is associated with digital eye strain.[5,6] This condition encompasses symptoms such as fatigue, dryness, and discomfort. The blue light emitted by the screen can interfere with the production of melatonin, a hormone responsible for regulating the sleep-wake cycles.[7] Increased screen time is often linked to reduced physical activity, as individuals spend extended time in front of screens.[8] Reduced screen time is often linked to reduced physical activity, which may increase stress, therefore, leading to poor quality of sleep. The immersive nature of screen-based activities, such as video games and social media, has raised concerns about attention span.[9]
Statement of the problem: Technology advances rapidly, contributing to the substantial increase in screen time among individuals of all age groups, profoundly affecting most students at MUST because of freedom and easy access to mobile phones, computers, laptops, and Wi-Fi. We noted that the readily available internet access on campuses and emerging types of social media platforms diverted the attention of the students to more screen time for non-academic performance. The trend raises concerns about its potential substandard sleep cause and unsatisfactory academic performance, as recorded by students in the past. Other students complained time after time about the noise other students continued to make while using these electronic gadgets up to late hours without controlling their volume or using earphones and headphones, calling for a study on the effects of using screens for non-academic purposes on sleep quality and academic performance.
Justifications
Education implications: With the growing integration of technology in education, it is essential to assess how screen time affects learning outcomes, helping to identify potential barriers to effective learning and changing education practices.
Educational guidance: Educators need evidence-based information to make informed decisions about screen-time limits for students’ learning.
Mental concerns: There’s a growing concern about the impact of screen time on mental health, stress, and depression, particularly among university students. Investigating these links is vital for addressing the mental well-being of students.
Sleep quality and pattern: Sleep quality and pattern affect the cardiac cycle rhythm. Poor sleep quality and irregular patterns interfere with normal cardiac cycle rhythm, a condition called arrhythmia, raising a need to advise students on the importance of maintaining good sleep quality and a constant sleep pattern.
Research questions
- What are the effects of non-academic purposes screen time on sleep and academic performance?
- Does adjusting screen light brightness affect academic performance and sleep?
- Does the type of screen affect academic performance and sleep?
e.g., LED: Light-emitting diode, LCD: Liquid crystal display, OLED: Organic light-emitting diode - What is the performance of the participants in terms of grades?
Objectives
General objective: Assessing the effects of using screens for non-academic purposes on sleep quality and academic performance.
Specific objectives:
- To determine if screen light brightness affects academic performance and
- To determine if the screen type affects academic performance and sleep, including LED, OLED, Active-Matrix Organic Light-Emitting Diode (AMOLED), LCD
- To assess the performance of participants in terms of
Literature review
The section reviews the present written academic sources on assessing the effects of non-academic purpose screen time on academic performance and sleep. Observing a regular sleep pattern ensures sound sleep. A report indicated that the more time spent watching on a screen, the more likely children are to have trouble falling asleep, leading to an irregular sleep schedule. According to scientists, an irregular sleep pattern causes insomnia or sleepless nights.[10] The health effect can disrupt the sleep pattern because of stress-induced insomnia. Scientists documented that irregular circadian rhythm caused by irregular sleep patterns is associated with the pathogenesis of sleep paralysis, which signifies a perceptual detachment, with relentless rapid eye movement (REM) into wakefulness, contributing to hallucinations. According to Lissak, excessive screen time relates to inadequate sleep and risk factors for cardiovascular diseases like high blood pressure, obesity, low high-density lipid (HDL) cholesterol, poor stress regulation, high sympathetic arousal and cortisol deregulation, and insulin resistance.[11] Other physical consequences include impaired vision and reduced bone Density. Furthermore, Pandya and coworkers suggested that there are mixed consequences of prolonged screen-time use and blurred comprehension between healthy and unhealthy social connections over digital media.[12] The duo argues further that the suggestions for negative implications (physical and mental) health warrant a strict need for inculcating healthy digital habits, especially knowing that digital technology is unavoidable. Another study on digital screen time during the COVID-19 pandemic suggested that varying screen time levels profoundly implicate their physical and mental wellness, as reported by Sultana and colleagues in 2021.[13] Research by Yara and colleagues (2023) reported that insufficient sleep associated with daytime sleepiness is predominant among the pediatric population and upsurges during adolescence.[14] It is theorized that prolonged screen use detrimentally disturbs sleep through numerous pathways. Nevertheless, the connotation between media device usage and poor sleep has been inadequately assessed due to the rapid development of these devices, which have outpaced research abilities. In the same study that aimed to assess the effect of screen use on sleep quality among adolescents in Riyadh, Saudi Arabia, an analytical cross-sectional study was carried out using a self-administered online questionnaire targeting all accessible Saudi adolescents in Riyadh. The final questionnaire was uploaded online using social media platforms to high schools and primary health care centers. The study questionnaire covered adolescent personal data, medical history, and screen use, including the type of devices used, duration of use per day and at bedtime, effects of using devices, and family and friends’ influence on using devices. Sleep quality was assessed using the Pittsburgh Sleep Quality Index.
A total of 324 adolescents fulfilling the inclusion criteria completed the study questionnaire. Adolescents’ ages ranged from 16 to 19 years, with a mean age of 17.5 ± 1.1 years. 113 (34.9%) of the study adolescents used screens for 6–8 hours daily, and 111 (34.3%) used screens for more than 8 hours daily. Of the study, 154 (47.5%) adolescents were good sleepers, while 170 (52.5%) were poor. The study revealed that adolescents in Riyadh had a high-frequency rate and duration of screen use, which may exceed 6 hours daily, with nearly half of them having poor sleep quality, feeling fatigue, daytime sleepiness, and lack of concentration. Qin et al recorded that adults living in China during the COVID-19 outbreak with more screen time had poor emotional states, suggesting a considerable health risk.[15] Poor emotional state can also lead to sleepless nights. Under materials and methods, a cross-sectional study aimed at surveying changes in activities and daily routines among Chinese citizens during home quarantine was employed. Physical activity data and sedentary time were collected using the Chinese-validated version of the International Physical Activity Questionnaire (IPAQ). 6 Mood was assessed using the Positive and Negative Affect Schedule (PANA) questionnaire of two 10-item scales. Ten items measured positively. Sleep deficits caused by the overuse of digital technology are observed among medical students. Due to the coronavirus disease 2019 (COVID-19) pandemic, an emergency remote teaching method was put into practice, which may have resulted in changes in the sleep-wake cycle. The balance between the influences of external and internal synchronizers can be affected by sudden alterations in daily life, including changes in nightly habits and sleep quality, which can lead to increased levels of anxiety and reduced functional performance.[16]
A report by Yah and associates suggested that watching television during school days negatively impacted academic performance, anxiety, and life satisfaction, but positively associated on non-school days with sleep.[17] They also recorded playing electronic games positively associated with snacking at night and less frequently eating breakfast, and negatively associated with sleep and self-esteem. Receiving electronic news and study materials on non-school days is negatively associated with academic performance, but positively associated with anxiety on school days. Using social networking sites is associated negatively with academic performance and positively associated with body mass index (BMI) z-score, academic performance, and anxiety. Screen time in adolescents is associated with unhealthy behaviors and undesirable psychological states that can contribute to poor quality of life. Birgitta and a workmate recorded that digital addiction is identified as functionally equivalent to all addictions, characterized by the compulsive, habitual, and uncontrolled use of digital devices and an excessively repeated engagement in a particular online behavior. Once the urge to be online has become uncontrollable, it is always accompanied by severe sleep loss, emotional distress, depression, and memory dysfunction. In extreme cases, it may lead to suicide. The syndrome has been linked to the known chronic effects of all drugs, producing disturbances in cellular and molecular mechanisms of the GABAergic and glutamatergic neurotransmitter systems. Dopamine and serotonin synaptic plasticity, essential for impulse control, memory, and sleep function, are measurably altered.[18]
Monique and associates acknowledge that using digital devices leads to forfeiture of sleep for screen time, psychological stimulation, alteration of sleep patterns, and circadian rhythm.[19] Another journal by Yeluri and partners indicated no association between either screen time or sleep quantity, or quality, or academic performance; but academic performance aligned with either improving sleep and optimal Pittsburg Sleep Quality Index scores.[20]
Chen and collaborators reported that light can regulate a variety of physiological functions, such as biological rhythms, sleep, arousal, cognition, and emotion, which change with duration, wavelength, and intensity of light. These non-visual responses originate via a specialized class of retinal neurons, the intrinsically photosensitive retinal ganglion cells (ipRGCs). These cells have their intrinsic sensitivity to light and combine this intrinsic melanopic input with rod and cone inputs. Since the discovery of ipRGCs, different action spectra and metrics have been proposed to estimate the potential melanopic contribution of lighting. Lucas et al. quantified the input from the different photoreceptor classes to non-visual systems via the α-opic metric in 2017. The metric can be used to calculate illuminance integrated within the intrinsic spectral sensitivity functions of rods, cones, and ipRGCs from any light spectra. The frequency and duration of using light-emitting devices after lights out will suppress the hormone melatonin and affect circadian health, leading to poor sleep quality, daytime sleepiness, insomnia, and other symptoms. Long-term diurnal rhythm disorder will increase the risk of chronic diseases.[21]
Research gaps
The existing information showed that the following gaps existed in the research topics related to using screen effects for non-academic purposes on sleep quality and academic performance.
- The effects of using different types of screens on academic performance and sleep quality have not been assessed.
- The effects of adjusting screen lights on academic performance and sleep quality have not been assessed.
- The effects of using different modes of screen settings (dark or light mode) on academic performance and sleep quality have not been assessed.
Furthermore, the previous studies conducted on screen time and its effects on academic performance were only on children in different parts of the world. Therefore, this raises a need to assess the effects of screen time for non-academic purposes on sleep quality and academic performance.
Independent variables
Using screens: This means time spent engrossed on screens from smartphones, computers, laptops, and other screen displays for games and entertainment, like TVs, for purposes other than academics. It’s measured in terms of hours per day.
- Screen mode: The settings of the phone screen are in either light or dark mode.
- Screen type: These include LCD, OLED, AMOLED display, and Capacitive Screens.
- Screen-Light: (Brightness) Means the minimum or maximum amount of light allowed by the user of screens with a feature that allows the settings in terms of percentage. 0 % means no light, and 100 % means maximum light possible.
Dependent variables
- Time spent sleeping at night, measured in hours per day.
- Academic performance is measured in terms of grades based on marks scored out of 100 percent.
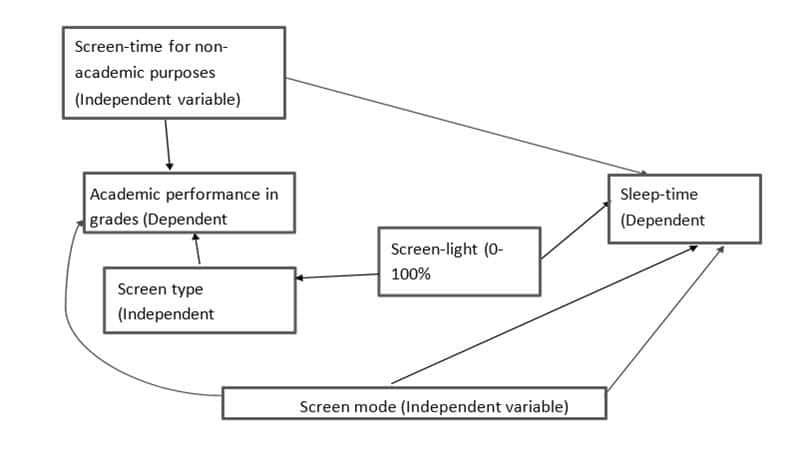
Figure 1: Showing the conceptual framework
Conceptual framework
The conceptual framework shows the perceived relationship between the independent variables and the dependent variable. It was expected that by spending too much time on screen doing stuff that doesn’t relate to academics, students were likely to be affected not only academically but also in the context of obtaining optimum sleep. Therefore, too much time on screens for non-academic purposes was expected to cause too little time on sleep and time dedicated for academic purposes, thereby, affecting both sleep quality and intellectual. Other factors of screen time were included as independent variables and were also expected to affect both sleep quality and time and academic performance negatively, or positively. They included screen-light adjustments, the light or dark mode of the screen, and the screen types used by the students.
Methodology
Study site: This study was conducted within MUST. The MUST lies on coordinates 0.13490 N, 37.70840 E Kenya. The code address, which locates its exact position on a map, is 4PH9 + C5. The community living around Meru University is popular for miraa (khat) and tea cash crops growing. The university borders the lower Mt Kenya forest and Meru Town to the West, Nchuura and Nyambene Hills, Isiolo Resort City, Lewa Downs Conservancy, Meru National Reserve to the North, Matiru and Mbutubutia Swamps. Furthermore, the university is within the Lamu Port South Sudan Ethiopia Transport Corridor (LAPPSET). It is also located opposite Njuri-Ncheke Centre and is separated by the Meru-Maua Road.
Research design: This research employed a cross-sectional design that guided us in collecting quantitative and qualitative data that supported us in assessing the effects of using screens for prolonged hours on academic performance and the quality of sleep.
Independent study variables: Screen-time is the independent variable and is measured in terms of hours per day. Other factors include different types of screens, eye protection modes such as limiting the amount of light and protection, and light and dark mode features of smartphones, computers, and laptops.
Dependent study variable: These include sleep quality expressed as the hours of sleep per day and academic performance, particularly focusing on grades.
Study population: Students from the School of Health Sciences at Meru University were selected as the study population for this research.
Inclusion and exclusion: Students pursuing degree courses in their third and fourth year of study were included because they have a record of academic results for a longer duration compared to their counterparts in the lower level of education. Therefore, those students below the third year level of education were excluded.
Sample size determination: The formula was used to calculate the sample size as follows[22]
N = (Z^2 * P * (1 – P)) / d^2
where,
N is the desired sample size when the target population is about 10000.
Z is the standard normal deviation at chosen confidence level (95% or 99%)
P is the expected proportion in the population with characteristics of interest (if unknown, 50% should be used)[19]
Q; is 1-P
D is the level of statistical significance or alpha (0.05 or 0.01). Calculations:
Sample Size, N = (Z^2 * P * (1 – P)) / d^2
∴ N= (1.96^2 * 50* (100-50)) / 5^2 = 384.16
N ≈ 385
Sampling procedure: Volunteer sampling, which is an example of non-probability sampling methods, was deployed to select the subset of the study population (sampled students). Volunteers were solicited through the internet through WhatsApp groups through posts and visited in person, where the aim of participation in the predetermined questionnaire was explained. Furthermore, the inclusion and exclusion criteria were also used to narrow the volunteers further to the desired characteristics of the sampled students. This was possible through a predetermined closed questionnaire that locked out volunteer participants with undesirable traits for the study.
Data collection: A structured pretest closed questionnaire was administered to the students in the School of Health Sciences in English, but the questionnaires were set to eliminate students in the first and second year because they unsatisfied the desired traits of the study. The purpose of the study and the participation in the questionnaire were clarified, and their consent was obtained prior to participation.
Data analysis and presentation: Data was keenly tabulated, edited, coded, and verified for proper analysis with the assistance of tools like Microsoft Excel. To ensure an objective analysis, the data was analyzed without bias by avoiding personal opinions and communicating only the results as per the collected data. The tools were manipulated to come up with a visually graphical representation and linear regressions.
Ethical considerations: The scientific approval was obtained from the School of Health Sciences at the MUST. Ethical clearance was sought from the MUST institutional research ethics review committee (MIRERC).
Results
The data collected based on the sample size (385) showed that there was a 100% turnout of participants. Among these, 191 were female and 194 males, which translates to 49.6% and 50.4% respectively. This is a very slight disparity, which shows gender equality in the participation. The data was collected in MUST, and based on exclusion and inclusion criteria, only students in the School of Health Sciences in years 3 and 4 were allowed to participate. The age ranged between 19 to 35 years, with most of them between 19 to 25 years.
The data was collected with appropriately designed measures, that is, a structured questionnaire with a predetermined framework that sets the precise language and sequence of questions. This was made possible through Google Forms. Data was then keenly tabulated, edited, coded, and verified for proper analysis with the assistance of the Microsoft Excel application. To ensure an objective analysis, the data was analyzed without bias by avoiding personal opinions to communicate the results based on the collected data. We conducted inferential statistical analyses involving correlation and linear regression models to examine the relationship between different pairs of variables, such as screen time against academic performance. Results were presented in the form of scatter plots and graphs.
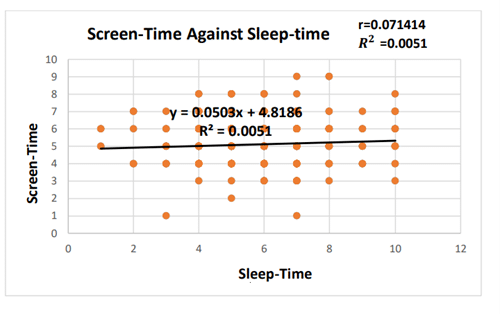
Figure 2: Screen time against sleep time
The scatter plot presents the relationship between screen time (x-axis) and sleep time (y-axis), with a linear regression of y = 0.0503 𝑥 + 4.8186, where Y represents sleep time and x represents screen time. The gradient (0503) suggests that for every one-unit increase in screen time, sleep time increases by 0.0503 hours- that is, about 3 minutes on average. The y-intercept (4.8186) indicates that when screen time is zero, the predicted sleep time is approximately 4.82 hours. The coefficient of determination (𝑅2 = 0.0051) implies that only 0.51% of the variation in sleep time is explained by the screen time. This indicates an extremely weak relationship between the two variables. The analysis suggests that the regression model weakly explains the relationship between screen time and sleep time. Other factors beyond screen time are likely to have a significant influence on sleep duration.
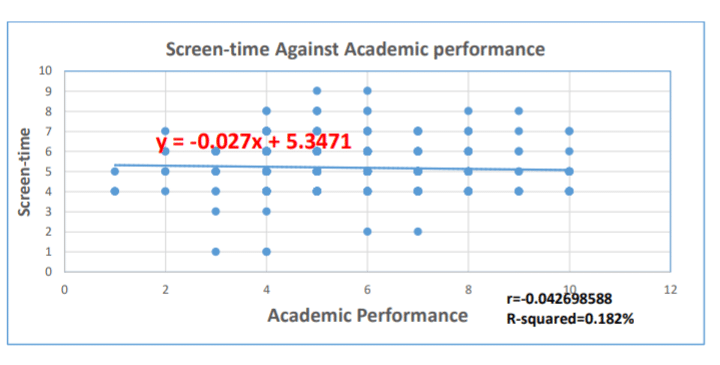
Figure 3: Screen-time against academic performance
Y represents academic performance, and x represents screen time. The slope of the graph (-0.027) implies that for every one-unit increase in screen time, academic performance decreases by 0.027 points, indicating a slight negative effect of screen time on academic performance. If the screen time were zero at the y-intercept (5.3471), the predicted academic performance would be 5.35 (assuming grading is out of 10). The correlation coefficient (𝑟 = −0.0427) portrays a very weak negative correlation between screen time and academic performance, meaning that as screen time increases, academic performance slightly decreases; the association is almost negligible. The coefficient of determination 𝑅2 = 0.182% indicates that only a tiny fraction of the variance in academic performance is explained by screen time.
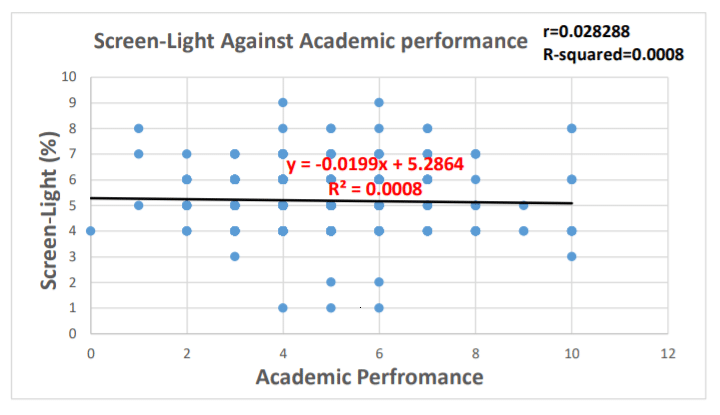
Figure 4: Screen light against academic performance
The scatter plot explores the relationship between screen light exposure (x-axis) and academic performance (y-axis). The slope (0.0199) indicates that for every one-unit increase in screen light brightness, academic performance increases by 0.0199 points on average. This suggests a very slight positive effect of screen light exposure on academic performance. The y-intercept of 5.2864 implies that if screen light brightness were zero, the predicted academic performance score would be 5.29 (on a scale of 1:10). The coefficient of determination (𝑅2 = 0.0008) indicates that only 0.08% of the variation in academic performance is explained by the screen light brightness. This also suggests that screen light brightness has an extremely weak effect on academic performance, and other factors are possibly responsible for the variation in academic performance.
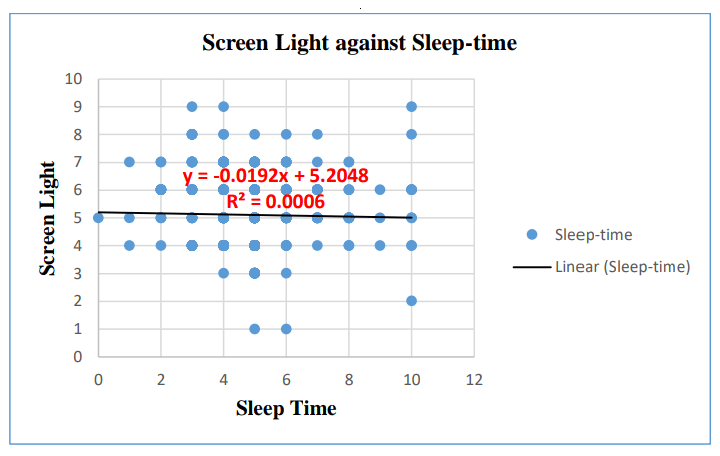
Figure 5: Screen light against sleep time
On the scatter plot, y represents sleep time in hours, and x represents light brightness (measurement of intensity). The gradient (-0.0192) proposes that for an increase in each unit of screen light brightness, sleep time decreases by approximately 0.0192 hours (about 1.15 minutes. The y-intercept of 5.2048 implies that when the screen light is zero, the predicted screen time is approximately 5.2 hours. The Pearson correlation coefficient r, which is 0.024494, indicates an extremely weak positive correlation between screen light brightness and sleep time. The positive figure is too close to zero to suggest a practically essential relationship between the two variables. The scatter plots reinforce the findings because they are considerably scattered around the regression line, indicating that other factors significantly influence sleep time more than screen light brightness.
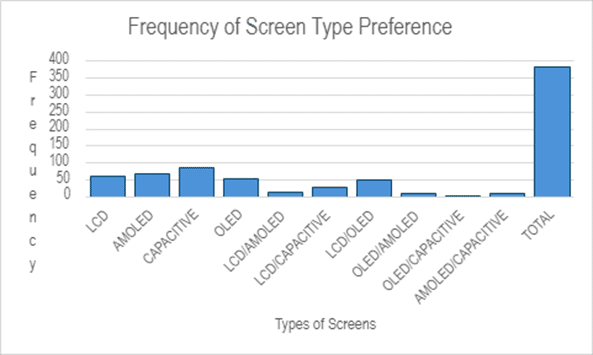
Figure 6: Frequency usage against screen types
It is evident that capacitive screens are preferred by most university students the most, followed by AMOLED, LCD, and OLED. It is also evident that students prefer a combination of LCD/OLED, mostly followed by LCD/CAPACITIVE, a pair of LCD/AMOLED, and OLED/AMOLED screen combinations in that order, with a combination of OLED/CAPACITIVE screens recording the least preference.
Discussion
The Literature review provides a broader picture of the variables analyzed in this research. The review reinforces that screen time disrupts sleep patterns, leading to issues like insomnia and sometimes cardiovascular complications, as recorded by Lissak.[11] However, our data suggests that this effect is not linear as previously thought. The data analyzed provides an extremely weak association between screen time and sleep, implying that other factors could be responsible for the poor sleep habits of the students.
While researchers like Yan and coworkers connect screen time with academic decline, the data we analyzed shows very little correlation, possibly indicating that other factors like stress, peer pressure, negative attitudes, psychosocial issues, and environment might play significant roles.[17] The psychological impacts portrayed by Birgitta, including digital addiction and its consequences, resonate with the probability that screen time affects well-being in many ways not captured by academic performance alone.[18] Chen’s manuscript on light’s physiological effects suggests a possible mechanism through ipRGCs, where screen light could theoretically affect sleep and mood.[21] Our data shows this impact might be less significant in real-world settings.
Limitations: The weak correlations imply that other variables not accounted for in this research might have influenced sleep time and academic performance more significantly than either screen time, screen light, or screen types. The tool used for measuring these variables might not be precise enough to capture the interaction between the variables. The data collection method might have led to inaccurate information, leading to discrepancies between this research and other literature. The students might have provided false information, leading to the differences between the information from the data analysis and the existing literature.
Further studies could explore different metrics for screen light, that is, blue light exposure, total screen time, and type of electronic gadgets (Smartphones, Laptops, Tablets, and Desktops), or differences within types, for example, Smartphones-Samsung, Tecno, Nokia-and laptops-HP (Hewlett Packard), Lenovo, Dell, and MacBook. Additional variables like age, lifestyle, caffeine intake, stress levels, sleeping pills, peer pressure, and negative attitude towards learning need are ripe for exploration. If the relationships are not linear, scientists should employ non-linear models or different statistical methods.
Conclusion
These analyses suggest that screen time, screen light, and screen types, components of screens as measured, have an extremely weak impact on sleep time and academic performance based on the data collected. However, this does not conclusively prove the absence of an effect; it might mean it is complex, mediated by confounding variables, or the data collected does not capture the relationship adequately.
Some conditions are necessary for optimum sleep quality, with total darkness, which enhances the production of the hormone melatonin, which plays a key role in inducing sleep, and minimal noise.[23-25] Interfering with one of these factors disrupts sleep, and it becomes difficult to achieve optimum sleep quality, at least 6 hours for a normal human being. The findings of this study underscore the universal nature of screen time among university students and its potential impact on academic performance and sleep quality. Addressing these concerns requires a multi-faceted approach, encompassing educational guidance, mental health support, and initiatives to promote healthy screen habits. By raising awareness and implementing evidence-based interventions, educational institutions can empower students to balance screen usage and academic success.
References
- Griffioen N, Scholten H, Lichtwarck-Aschoff A, Van Rooij M, Granic I. Everyone does it differently: A window into emerging adults’ smartphone use. Humanit Soc Sci Commun. 2021;8(1):177. doi.10.1057/s41599-021-00863-1
Crossref | Google Scholar - Gupta N. Impact of smartphone overuse on health and well-being: Review and recommendations for life-technology balance. J Appl Sci Clin Pract. 2023;4(1):4. doi.10.4103/jascp.jascp_40_22 Crossref | Google Scholar
- Agorastos A, Olff M. Sleep, circadian system and traumatic stress. Eur J Psychotraumatol. 2021;12(1):1956746. doi.10.1080/20008198.2021.1956746 PubMed | Crossref | Google Scholar
- Steinach M, Kohlberg E, Maggioni MA, et al. Sleep quality changes during overwintering at the German Antarctic Stations Neumayer II and III: The gender factor. PLoS One. 2016;11(2):e0150099. doi.10.1371/journal.pone.0150099 PubMed | Crossref | Google Scholar
- Coles-Brennan C, Sulley A, Young G. Management of digital eye strain. Clin Exp Optom. 2019;102(1):18-29. doi.10.1111/cxo.12798 PubMed | Crossref | Google Scholar
- Kaur K, Gurnani B, Nayak S, et al. Digital eye strain: A comprehensive review. Ophthalmol Ther. 2022;11(5):1655-1680. doi.10.1007/s40123-022-00540-9 PubMed | Crossref | Google Scholar
- Abbott KS. Influence of light exposure on the melanopsin-driven pupil response and circadian rhythm. Master’s thesis. University of Houston; 2018. Influence of Light Exposure on the Melanopsin Driven Pupil Response and Circadian Rhythm – ADS Google Scholar
- García-Hermoso A, Marina R. Relationship of weight status, physical activity, and screen time with academic achievement in adolescents. Obes Res Clin Pract. 2017;11(1):44-50. doi.10.1016/j.orcp.2015.07.006
PubMed | Crossref | Google Scholar - Vedechkina M, Borgonovi F. A review of evidence on the role of digital technology in shaping attention and cognitive control in children. Front Psychol. 2021;12:611155. doi.10.3389/fpsyg.2021.611155 PubMed | Google Scholar
- Hale L, Kirschen GW, LeBourgeois MK, et al. Youth screen media habits and sleep. Child Adolesc Psychiatr Clin N Am. 2018;27(2):229-245. doi.10.1016/j.chc.2017.11.014 PubMed | Crossref | Google Scholar
- Lissak G. Adverse physiological and psychological effects of screen time on children and adolescents: Literature review and case study. Environ Res. 2018;164:149-157. doi.10.1016/j.envres.2018.01.015 PubMed | Crossref | Google Scholar
- Pandya A, Lodha P. Social connectedness, excessive screen time during COVID-19 and mental health: A review of current evidence. Front Hum Dyn. 2021;3:684137. doi.10.3389/fhumd.2021.684137 Crossref | Google Scholar
- Sultana A, Tasnim S, Hossain MM, Bhattacharya S, Purohit N. Digital screen time during the COVID-19 pandemic: a public health concern. F1000Res. 2021;10:81. doi.10.12688/f1000research.50880.1 Crossref | Google Scholar
- Alshoaibi Y, Bafil W, Rahim M. The effect of screen use on sleep quality among adolescents in Riyadh, Saudi Arabia. J Family Med Prim Care. 2023;12(7):1379-1388. doi.10.4103/jfmpc.jfmpc_159_23 PubMed | Crossref | Google Scholar
- Qin F, Song Y, Nassis GP, et al. Prevalence of insufficient physical activity, sedentary screen time, and emotional well-being during the early days of the 2019 novel coronavirus (COVID-19) outbreak in China: A national cross-sectional study. SSRN Journal. 2020. doi.10.2139/ssrn.3566176 Google Scholar
- Cabral LGL, Queiroz TN, Pol-Fachin L, Santos ARLD. Digital technology and its impacts on sleep quality and academic performance during the pandemic. Arq Neuropsiquiatr. 2022;80(10):1052-1056. doi.10.1055/s-0042-1755395
PubMed | Crossref | Google Scholar - Yan H, Zhang R, Oniffrey TM, et al. Associations among screen time and unhealthy behaviors, academic performance, and well-being in Chinese adolescents. Int J Environ Res Public Health. 2017;14(6). doi.10.3390/ijerph14060596 PubMed | Crossref | Google Scholar
- Dresp-Langley B, Hutt A. Digital addiction and sleep. Int J Environ Res Public Health. 2022;19(11):6910. doi.10.3390/ijerph19116910 PubMed | Crossref | Google Scholar
- LeBourgeois MK, Hale L, Chang AM, Akacem LD, Montgomery-Downs HE, Buxton OM. Digital media and sleep in childhood and adolescence. Pediatrics. 2017;140(Supplement_2):S92-96. doi.10.1542/peds.2016-1758J
PubMed | Crossref | Google Scholar - Yeluri K, Hs K, H BG, Bj SC. Electronic gadget screen-time, perceived sleep quality & quantity, and academic performance in medical students. J Assoc Physicians India. 2021;69(11):11-12. Electronic Gadget Screen-time, Perceived Sleep Quality & Quantity and Academic Performance in Medical Students | Request PDF PubMed | Google Scholar
- Xu W, Wu P, Yao Q, et al. Does the smartphone’s eye protection mode work? Opt Express. 2023;31(6):10420. Doi.10.1364/OE.485195 PubMed | Crossref | Google Scholar
- Fisher AA, Laing JE, Stoeckel JE, Townsend J. Handbook for Family Planning Operations Research Design. 2nd ed. Population Council; 1991. doi:10.31899/rh10.1039 Crossref | Google Scholar
- Gabinet NM. Effects mediated by melatonin and cortisol of artificial light and noise, alone and in combination, on sleep and health. Explor Neurosci. 2024;3(5):382-417. doi.10.37349/en.2024.00057 Crossref | Google Scholar
- Caddick ZA, Gregory K, Arsintescu L, Flynn-Evans EE. A review of the environmental parameters necessary for an optimal sleep environment. Build Environ. 2018;132:11-20. doi.10.1016/j.buildenv.2018.01.020 Crossref | Google Scholar
- Bani Younis M, Hayajneh F, Alshraideh JA. Effect of noise and light levels on sleep of intensive care unit patients. Nurs Crit Care. 2021;26(2):73-78. doi.10.1111/nicc.12490 PubMed | Crossref | Google Scholar
Acknowledgments
We extend our sincere gratitude to our supervisor, Dr. Dorothy Kagendo, for her invaluable guidance and unwavering support throughout every stage of this research. Her selfless dedication served as a guiding light, and we remain deeply indebted for her contribution to the successful completion of this work.
Funding
This research received no external funding. The authors covered all costs associated with the study.
- Network access, including data and related services, amounts to Kshs. 1000.
- Transport costs are estimated at Kshs. 500.
- Project tools, such as a computer and other necessary equipment, require Kshs. 500.
- A contingency fund, calculated as 10% of the total budget, is Kshs. 200.
- The net total for all expenses is Kshs. 2200.
Author Information
Corresponding Author:
Benard Ochieng Otieno
Department of Public Health
School of Health Sciences, Meru University of Science and Technology, Kenya
Email: benochih@gmail.com
Co-Authors:
John Yusuf, Prochorus Kibet, Emmanuel Kirui
Department of Public Health
School of Health Sciences, Meru University of Science and Technology, Kenya
Authors Contributions
Benard Ochieng Otieno, as the first author of this research article, contributed to proposal development, data collection, analysis, interpretation, writing the research article, and addressing peer review comments. John Yusuf Hatwab, Prochorus Kibet, and Emmanuel Kirui are second authors who contributed equally to proposal development and data collection.
Ethical Approval
The scientific approval was obtained from the School of Health Sciences at the MUST. Ethical clearance was sought from the MIRERC.
Conflict of Interest Statement
The authors declare no conflicts of interest.
Guarantor
None
DOI
Cite this Article
Benard OO, John YH, Prochorus K, Emmanuel K. Assessing the effects of screen time for nonacademic purposes on sleep quality and academic performance in Meru University of Science and Technology. medtigo J Med. 2025;3(1):e 30623125. doi:10.63096/medtigo30623125 Crossref