


 Author Affiliations
Abstract
Cancer remains the second leading cause of death globally, responsible for nearly 10 million deaths in 2020, accounting for approximately one in six deaths. In India, the estimated burden of cancer ranges from 2 to 2.5 million cases at any given time. The complexity of cancer treatment, often involving a multimodal therapeutic approach, significantly increases the risk of drug-related problems (DRPs) among patients. This observational study was conducted in a tertiary care hospital to evaluate the prevalence and nature of DRPs among cancer patients. A total of 107 patients who met the inclusion and exclusion criteria were enrolled in the study. Of these, 88 patients (82.2%) reported a total of 325 DRPs, while 19 patients did not experience any DRPs. The occurrence of DRPs was slightly higher in male patients (54.5%) compared to females (45.4%), with the majority occurring in the 66–75-year age group. Among the 325 identified DRPs, 34.4% were classified as treated (severe and life-threatening), while the remaining 65.5% were untreated due to their self-limiting nature and minimal impact on patient health or quality of life. These findings underscore the need for enhanced pharmacovigilance and clinical interventions to mitigate DRPs in cancer care.
Keywords
Cancer, Chemotherapy, Drug-related problems, Adverse drug reaction, Pharmaceutical care network Europe, Common terminology criteria for adverse events (CTCAE).
Introduction
Cancer is a group of many different diseases that are characterized by uncontrolled cellular growth, local tissue invasion, and distant metastases. It causes cellular changes in the form of uncontrolled proliferation and spread of abnormal cells. The state of spreading cancer cells to distant tissues or organs is known as metastasis. Other common names are malignant tumors and neoplasms. Nowadays, cancer has become a leading cause of premature death and disability. The most common in 2020 (in terms of new cases of cancer) were breast (2.26 million cases), lung (2.21 million cases), colon and rectum (1.93 million cases), prostate (1.41 million cases), skin (non-melanoma) (1.20 million cases) and stomach (1.09 million cases). The most common causes of cancer death in 2020 were lung (1.80 million deaths), colon and rectum (916,000 deaths), liver (830,000 deaths), stomach (769,000 deaths), and breast (685,000 deaths).[1-4]
Cancer patients are at a significantly increased risk of drug-related problems due to the combination of multiple drugs. Chemotherapy, a multimodal approach to oncological treatment, involves highly complex regimens and a narrow therapeutic range of anticancer drugs. Reviewing drug-related problems would provide an approach to decrease the frequency of DRPs in cancer patients.[5] DRPs are associated with failure in achieving the desired outcomes, increased morbidity and mortality, increased length of hospitalization, increased cost of treating diseases, decreased quality of patients’ lives, and people dissatisfied with their treatment.[6]The risks of developing a DRP include advanced age with a high burden of chronic comorbidities, polypharmacy, severe disease, renal impairment, frequent changes in drug treatment, and length of hospital stay. Age, sex, length of hospital stays, stages of cancer, number of medications, comorbidity, histopathological grading, and complications are the important determinants of DRP development.[8]
According to the American Society of Hospital Pharmacists classification system, DRPs can be classified as:
- Actual and potential adverse drug events.
- Actual and potential clinically significant drug-drug, drug-disease, drug-nutrient, and drug laboratory test interactions.
- Inappropriate dose, dosage form, schedule.
- Route of administration or method of administration.
- Failure of the patient to adhere to the regimen.
- Medication with no indication.
- Condition for which no drug is prescribed.
- Medication is prescribed inappropriately for a particular condition.
- Therapeutic duplication.
- Prescribing of medication to which the patient is allergic.
- Interference with medical therapy by social or recreational drug use.
- Failure to receive the full benefit of prescribed therapy.
- Problems arising from the financial impact of therapy.
- Lack of understanding of the medication.[9,10]
Various studies have shown that Adverse drug reactions (ADRs), the need for additional drug therapy, and drug-drug interactions (DDI) are the most prevalent DRPs. Drug-drug interactions are common since the drugs used in the management of cancer and associated comorbidities may have pharmacokinetic and pharmacodynamic effects on each other. A comprehensive study of DRPs would provide valuable insight for healthcare providers to reduce the incidence of DRPs and improve treatment outcomes in cancer patients.[11]
This study was conducted to analyze the DRPs in the treatment of cancer patients in real-world clinical practice to detect the different types of DRPs, understand their severity, and evaluate the management of DRPs. To aid in the improvement of patients’ QOL, to reduce hospitalization, and to avoid the unnecessary economic burden on the patient and the health care system.
Methodology
Study site: The study was conducted at Continental Hospitals, Nanakramguda, Gachibowli, Hyderabad, Telangana, India.
Study duration: The data was collected for a period of six months.
Study design: An observational study
Sample size: A total of 107 subjects were included in the study.
Inclusion criteria:
- Patients with a Confirmed diagnosis of cancer
- Aged above 2 years
- Either sex
- Chemotherapy
- Immunotherapy
- Targeted therapy
- Patients on hormonal treatment
Exclusion criteria: Neonates & infants
Data collection: This was a single-center observational study conducted on cancer patients who received chemotherapy. Data were collected from electronic records, patient medication charts, nurse notes, and clinical case sheets of the hospital and reviewed by study coordinators to ensure patient outcomes. Assessing the study parameters, a Data collection form was designed and used for Data collection.
Data analysis: Microsoft Excel was used to analyze patient data obtained from electronic records, nurse notes, and clinical case sheets of the hospital.
Results
Age-wise distribution of cancer patients: Out of 107 patients, the most affected patients were from the age group of 66-75 years. The mean age of the study population was 54 years.
| Age groups (years) | Frequency(N=107) | Percentage (%) |
| 5 -15 | 4 | 3.7% |
| 16-25 | 0 | 0% |
| 26-35 | 5 | 4.6% |
| 36-45 | 18 | 16.8% |
| 46-55 | 24 | 22.4% |
| 56-65 | 25 | 23.3% |
| 66-75 | 27 | 25.2% |
| 76-85 | 4 | 3.7% |
| Mean age | 55 years | |
Table 1: Frequency and percentage of cancer patients based on age
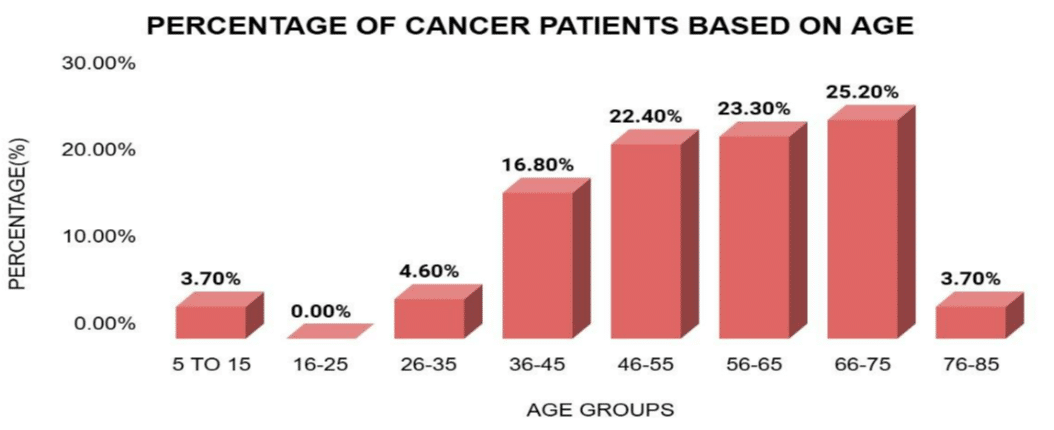
Figure 1: Frequency and percentage of cancer patients based on age
Gender-wise distribution of cancer patients: In this study, a total of 107 patients were included. Among these, females were more prone to different types of cancers than males.
| Gender | Frequency (N=107) | Percentage (%) |
| Males | 53 | 49.50% |
| Females | 54 | 50.40% |
| Total | 107 | 100% |
Table 2: Frequency and percentage of cancer patients based on gender
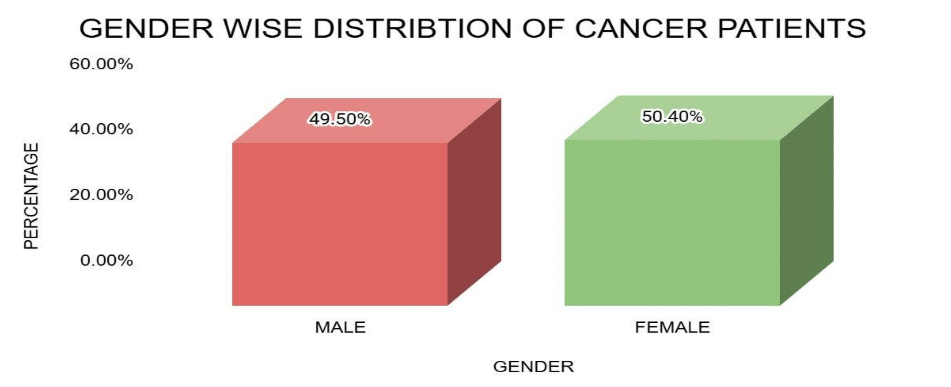
Figure 2: Frequency and percentage of cancer patients based on gender
Prescribed pattern of chemotherapeutic drugs: Out of 107 prescriptions, the maximum no. of patients were undergoing treatment with platinum coordination complexes (23.9%), microtubule-damaging agents (17.2%), and anti-metabolites (13.3%).
| Class of drugs | Drugs | Frequency(N) | Total | Percentage(%) |
| Alkylating agents | Cyclophosphamide | 17 | 19 | 7.4% |
| Dacarbazine | 2 | |||
| Platinum coordination complexes | Oxaliplatin | 22 | 61 | 23.9% |
| Carboplatin | 31 | |||
| Cisplatin | 8 | |||
| Antimetabolites | Methotrexate | 3 | 34 | 13.3% |
| Pemetrexed | 3 | |||
| 6-Mercaptopurine | 2 | |||
| 5-Fluorouracil | 18 | |||
| Gemcitabine | 6 | |||
| Capecitabine | 2 | |||
| Microtubule-damaging agents | Vincristine | 8 | 44 | 17.2% |
| Paclitaxel | 22 | |||
| Docetaxel | 12 | |||
| Vinblastine | 2 | |||
| Topoisomerase-1 inhibitors | Irinotecan | 5 | 5 | 1.9% |
| Topoisomerase-2 inhibitors | Etoposide | 4 | 4 | 1.5% |
| Antibiotics | Doxorubicin | 11 | 15 | 5.8% |
| Daunorubicin | 1 | |||
| Bleomycin | 3 | |||
| Miscellaneous | Arsenic trioxide | 1 | 1 | 0.3% |
| SER down regulators | Fulvestrant | 2 | 2 | 0.7% |
| CD20 inhibitors | Rituximab | 4 | 4 | 1.5% |
| HER receptor inhibitors | Trastuzumab | 7 | 7 | 2.7% |
| Angiogenesis inhibitor | Bevacizumab | 16 | 16 | 6.2% |
| Proteasome inhibitor | Bortezomib | 5 | 5 | 1.9% |
| GNRH Analogues | Leuprolide | 5 | 5 | 1.9% |
| Others | Zoledronic acid | 11 | 33 | 12.9% |
| Leucovorin | 15 | |||
| Denosumab | 2 | |||
| Romiplostim | 1 | |||
| Nivolumab | 2 | |||
| Degarelix | 2 |
Table 3: Frequency and percentage of chemotherapeutic drugs prescribed
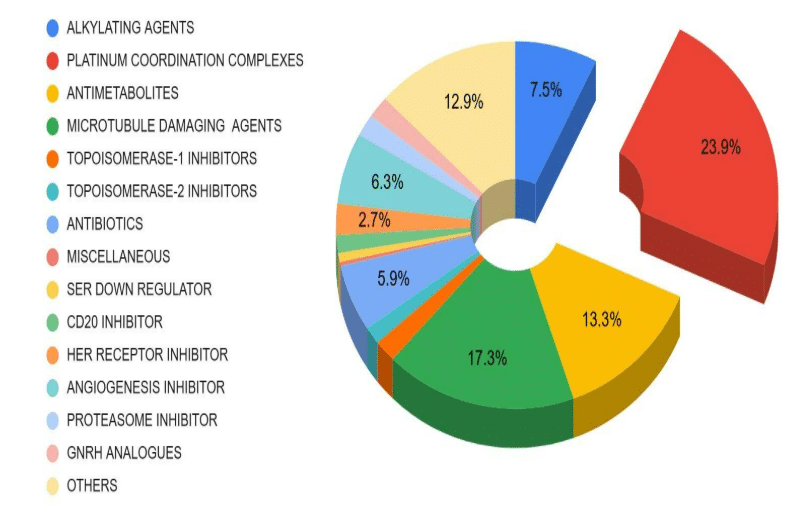
Figure 3: Frequency and percentage of chemotherapeutic drugs prescribed
Distribution of various types of DRPs: In this study, a total of 325 DRPs were identified among the patients. The most prevalent type of DRP was ADRs (n=265), followed by drug interactions (n=38) and dosing errors (n=22).
| Types of DRPS | No of DRPS | Percentage (%) |
| ADRS | 265 | 61.90% |
| Dosing errors | 22 | 17.50% |
| Drug interactions | 38 | 20.60% |
| Potentially inappropriate medications (PIMs) | 0 | 0% |
| Non-compliance | 0 | 0% |
Table 4: Frequency and percentage distribution of DRPS
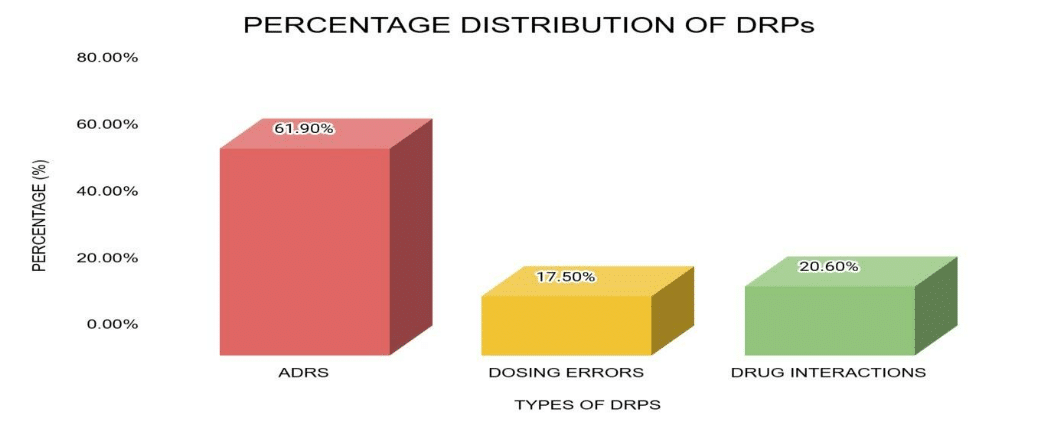
Figure 4: Frequency and percentage distribution of DRPS
Prevalence rate of DRPs: A total of 325 DRPs were identified in 88 patients, resulting in a prevalence rate of 82.2%.
| Category | No. of cases | Total population | Prevalence rate |
| DRPs | 88 | 107 | 82.2% |
Table 5: Prevalence rate of DRPS
| DRPs | Gender | Percentage (%) | ||
| Male | Female | Male | Female | |
| ADRS | 143 | 122 | 53.96% | 46.04% |
| DDI | 30 | 8 | 78.95% | 21.05% |
| Dosing errors | 9 | 13 | 40.90% | 59.09% |
| Non-compliance | 0 | 0 | 0 | 0 |
| PIMS | 0 | 0 | 0 | 0 |
Table 6: Distribution of DRPs based on gender
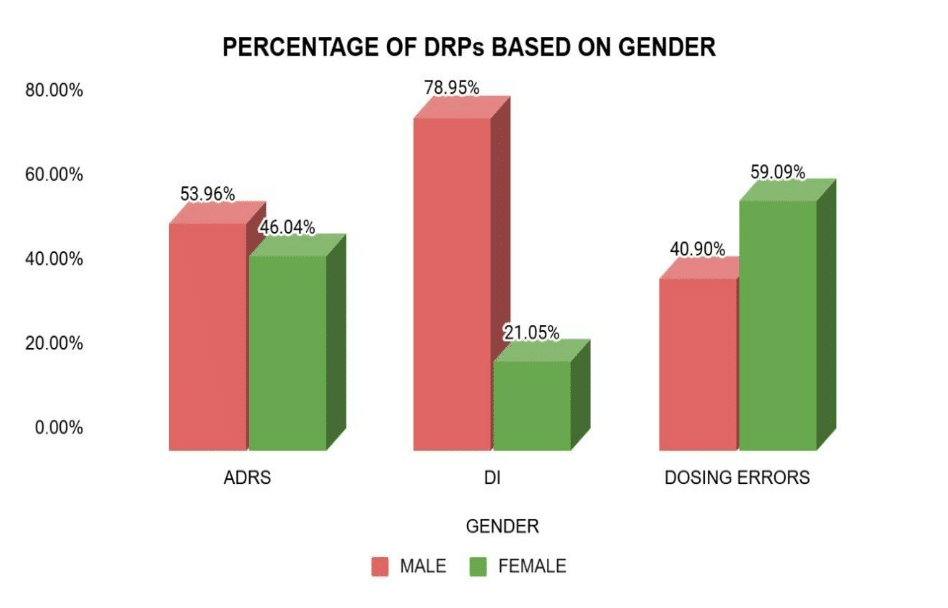
Figure 5: Distribution of DRPs based on gender
Chi-square analysis of DRPs: Chi-square test was applied to assess the difference in DRPS between males and females in cancer patients. P-value of <0.05 is considered significant. Chi-square test revealed that there is a statistical difference in the DRPs between males and females in cancer patients. This study reveals that males are more prone to DRPs when compared to females.
| Category | (O – E) ²/ E (Males) | (O – E) ²/ E (Females) |
| ADRs | 0.196495957 | 0.250085763 |
| DDI | 3.573233083 | 4.547751196 |
| Dosing errors | 0.894675325 | 1.138677686 |
| Total | 4.664404364 | 5.936514645 |
| χ2 | 10.6 | |
| P-value | 0.006 | |
Table 7: Chi-square table of DRPs
Anatomical classification of ADRs: This study revealed that the highest percentage of ADRs was related to the hematological system, followed by the gastrointestinal system.
| Organ system | No. of cases prone toADRs | Percentage (%) |
| Hematological system | 134 | 50.56% |
| Gastro-intestinal system | 39 | 14.71% |
| Nervous system | 5 | 1.88% |
| Cardiovascular system | 5 | 1.88% |
| Respiratory system | 5 | 1.88% |
| Hepatic system | 14 | 5.28% |
| Dermatological system | 15 | 5.66% |
| Renal system | 6 | 2.26% |
| Endocrine system | 2 | 0.75% |
| Unspecific | 40 | 15.09% |
Table 8: Anatomical classification of ADRs
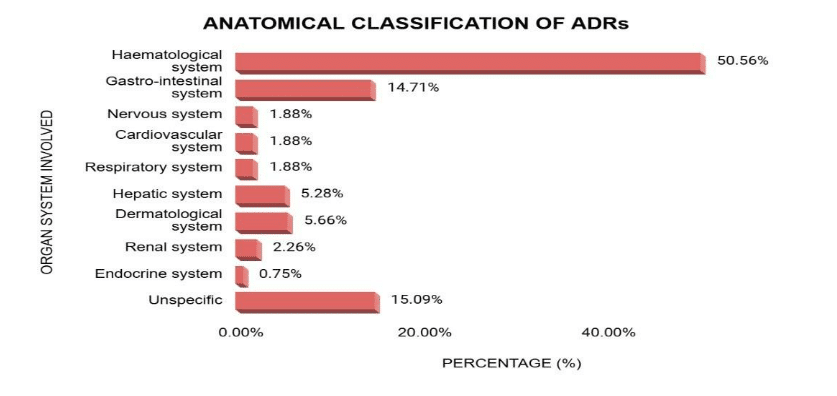
Figure 6: Anatomical classification of ADRs
Severity assessment of ADRS according to common terminology criteria for adverse events (CTCAE)scale: The pattern of ADRs among patients during the study period showed that 78 patients experienced ADRs affecting various organ systems. The highest number of ADRs was related to the hematological system, with a total of 134 ADRs of different grades, including anemia (Grade I-23, Grade II-19, Grade III-8), lymphocytopenia (Grade I-2, Grade II-5, Grade III-7), erythrocytopenia (Grade I-8, Grade II-5), leukopenia (Grade I-5, Grade II-3, Grade III-2), leukocytosis (Grade I-6, Grade II-1, Grade III-3), and thrombocytopenia (Grade I-7, Grade II-1). In contrast, the fewest ADRs were related to the endocrine system, with a total of 2 ADRs, including hypothyroidism (Grade I-1) and hyperthyroidism (Grade II-1).
| Organ system | ADRs involved | Grade-I | Grade-II | Grade-III | Grade-IV | Grade-V | No. of cases | Percentage (%) |
| Gastrointestinal (GI) system | Vomiting | 1 | 1 | – | – | – | 1 | 3.10% |
| Nausea | 1 | 1 | – | – | – | 2 | 6.20% | |
| Anorexia | 2 | 2 | – | – | – | 3 | 9.30% | |
| Diarrhea | 5 | 1 | – | – | – | 7 | 21.80% | |
| Constipation | 4 | 3 | – | – | – | 5 | 15.60% | |
| Weight loss | 2 | 1 | – | – | – | 2 | 6.20% | |
| Abdominal pain | 7 | – | – | – | – | 10 | 31.20% | |
| Polyuria | 1 | – | – | – | – | 1 | 3.10% | |
| Indigestion | – | – | – | – | – | 1 | 3.10% | |
| Total | 23 | 9 | 0 | 0 | 0 | 32 | 99.60% | |
| Blood | Anemia | 23 | 19 | 8 | – | – | 50 | 37.30% |
| Thrombocytopenia | 7 | 1 | – | – | – | 8 | 5.90% | |
| Leukopenia | 5 | 3 | 2 | – | – | 10 | 7.40% | |
| Neutropenia | 2 | -1 | – | – | – | 2 | 1.40% | |
| Thrombocytosis | 4 | 1 | – | – | – | 5 | 3.70% | |
| Neutrophilia | 6 | 1 | – | – | – | 7 | 5.20% | |
| Eosinophilia | – | 5 | – | – | – | 1 | 0.70% | |
| Monocytosis | 6 | 1 | 3 | – | – | 5 | 3.70% | |
| Leukocytosis | 2 | 5 | 7 | – | – | 10 | 7.40% | |
| Lymphocytopenia | 1 | 3 | – | – | – | 14 | 10.40% | |
| Lymphocytosis | 8 | 5 | 1 | – | – | 4 | 2.90% | |
| Erythrocytopenia | 1 | 2 | – | – | – | 13 | 9.70% | |
| High CRP | 1 | – | – | – | – | 4 | 2.90% | |
| High ESR | – | – | – | – | – | 1 | 0.70% | |
| Total | 66 | 47 | 21 | 0 | 0 | 134 | 99.30% | |
| Hepatic system | Increased level of | 3 | 1 | 4 | – | – | 8 | 57.10% |
| Hepatic enzymes | 2 | – | – | – | – | 2 | 14.20% | |
| Hypoproteinemia | 1 | 2 | – | – | – | 1 | 7.10% | |
| Hyperproteinemia | – | 1 | – | – | – | 2 | 14.20% | |
| Hypoalbuminemia | – | – | – | – | – | 1 | 7.10% | |
| Hyperbilirubinemia | – | – | – | – | – | – | – | |
| Total | 6 | 4 | 4 | 0 | 0 | 14 | 99.70% | |
| Unspecific | Fatigue | 3 | 3 | 1 | – | – | 7 | 17.50% |
| Body pains | 4 | 4 | – | – | – | 8 | 20% | |
| Pain during micturition | 1 | 2 | – | – | – | 3 | 7.50% | |
| Edema | 1 | 3 | – | – | – | 4 | 10% | |
| Fever menstrual | 3 | – | – | – | – | 3 | 7.50% | |
| irregularities | 2 | 5 | – | – | – | 2 | 5% | |
| Hyperglycemia | 2 | 1 | – | – | – | 7 | 17.50% | |
| Low creatinine | 1 | – | – | – | – | 1 | 2.50% | |
| Sweating | 1 | – | – | – | – | 1 | 2.50% | |
| Obstruction in throat | – | – | – | – | – | 1 | 2.50% | |
| Anxiety | – | – | – | – | – | 1 | 2.50% | |
| Vitamin deficiency | 2 | – | – | – | – | 2 | 5% | |
| Total | 21 | 18 | 1 | 0 | 0 | 40 | 100% | |
| Respiratory | Shortness of breath (SOB) | 1 | – | – | – | – | 1 | 20% |
| Hypoxemia | 1 | – | – | – | – | 1 | 20% | |
| Dyspnea | 1 | 1 | – | – | – | 1 | 20% | |
| Cold & Cough | – | 1 | – | – | – | 2 | 40% | |
| Total | 3 | 2 | 0 | 0 | 0 | 5 | 100% | |
| Skin | Alopecia | 1 | 2 | – | – | – | 3 | 20% |
| White spots on stomach | 1 | – | – | – | – | 1 | 6.60% | |
| Allergies | 1 | 3 | – | – | – | 4 | 26.60% | |
| Discoloration of skin | 2 | – | – | – | – | 2 | 13.30% | |
| Discoloration of nails | 1 | – | – | – | – | 1 | 6.60% | |
| Cyanosis | 1 | 1 | – | – | – | 1 | 6.60% | |
| Dryness of skin | – | 1 | – | – | – | 1 | 6.60% | |
| Redness of face | 1 | – | – | – | – | 1 | 6.60% | |
| Pigmentation | – | 1 | – | – | – | 1 | 6.60% | |
| Total | 8 | 7 | 0 | 0 | 0 | 15 | 99.50% | |
| Nervous system | Neuropathic pain | 1 | – | – | – | – | 1 | 20% |
| Insomnia | 1 | – | – | – | – | 1 | 20% | |
| Fainting | 1 | – | – | – | – | 1 | 20% | |
| Tingling sensation | 1 | – | – | – | – | 1 | 20% | |
| Numbness | 1 | – | – | – | – | 1 | 20% | |
| Total | 5 | 0 | 0 | 0 | 0 | 5 | 100% | |
| Electrolyte imbalance | Hyponatremia | 1 | 2 | – | 1 | – | 4 | 66.60% |
| Hypokalaemia | 1 | – | – | – | – | 1 | 16.60% | |
| Hypercalcemia | 1 | – | – | – | – | 1 | 16.60% | |
| Total | 3 | 2 | 0 | 1 | 0 | 6 | 99.80% | |
| Oral cavity | Ulceration | 2 | 2 | -1 | – | – | 4 | 57.10% |
| Mucositis | 1 | 1 | – | – | – | 2 | 28.50% | |
| Dry mouth | – | – | – | 1 | 14.20% | |||
| Total | 3 | 3 | 1 | 0 | 0 | 7 | 99.80% | |
| Cardiovascular system (CVS) | BP | 2 | – | – | – | – | 2 | 40% |
| Bradycardia | 2 | – | – | – | – | 2 | 40% | |
| Elevated N-terminal pro B-type natriuretic peptide (NT BNP) | 1 | – | – | – | – | 1 | 20% | |
| Total | 5 | 0 | 0 | 0 | 0 | 5 | 100% | |
| Thyroid stimulating hormone (TSH) | Hypothyroidism | 1 | – | – | – | – | 1 | 50% |
| Hyperthyroidism | – | 1 | – | – | – | 1 | 50% | |
| Total | 1 | 1 | 0 | 0 | 0 | 2 | 100% | |
| Overall total | 144 | 93 | 27 | 1 | 0 | 265 | ||
Table 9: Severity assessment of ADRs according to CTCAE scale
Severity assessment of ADRs: In the overall study period, a total of 265 ADRs with different grades were identified. In that maximum no. of people affected with Grade-I ADRs (54.3%; n=144), Grade-II ADRs (35.0%; n=93), and a very few people developed Grade-III ADRs (10.1%; n=27) and Grade-IV ADRs (0.3%; n=1).
| S.No. | GRADE | Frequency (N=265) | Percentage (%) |
| 1 | GRADE- I (Mild) | 144 | 54.3% |
| 2 | GRADE- II (Moderate) | 93 | 35.0% |
| 3 | GRADE-III (Severe) | 27 | 10.1% |
| 4 | GRADE- IV (Life threatening) | 1 | 0.3% |
| Total | 265 | 100% |
Table 10: Severity assessment of ADRs- GRADE
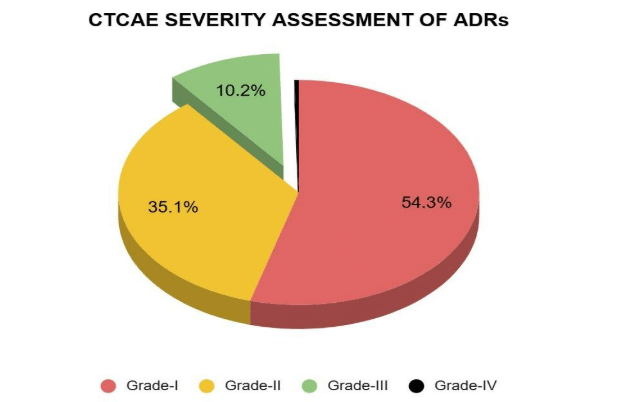
Figure 7: Severity assessment of ADRs- GRADE
Dosing errors: In this study, out of 22 (100%) dosing errors, 18 were underdose (81.8%) and 4 were overdose (18.1%).
| Dosing errors | Frequency(N=22) | Percentage (%) |
| Underdose | 18 | 81.8% |
| Overdose | 4 | 18.1% |
| Total | 22 | 100% |
Table 11: Frequency and percentage of dosing errors
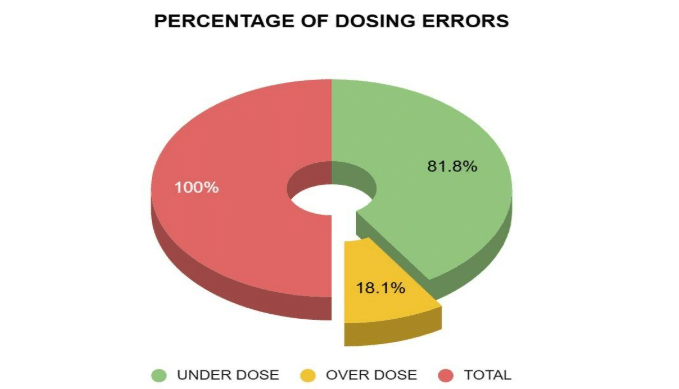
Figure 8: Frequency and percentage of dosing errors
DDIs: Out of 38 DDIs, a significant portion involves oxaliplatin and ondansetron.
| S.No | Drugs | Frequency(N) | Percentage (%) |
| 1 | Leuprolide + Ondansetron | 2 | 0.6% |
| 2 | Oxaliplatin + Ondansetron | 22 | 6.7% |
| 3 | Oxaliplatin + 5-Fluorouracil | 13 | 4.0% |
| 4 | Arsenic trioxide + Ondansetron | 1 | 0.3% |
Table 12: Frequency and percentage of DDIs
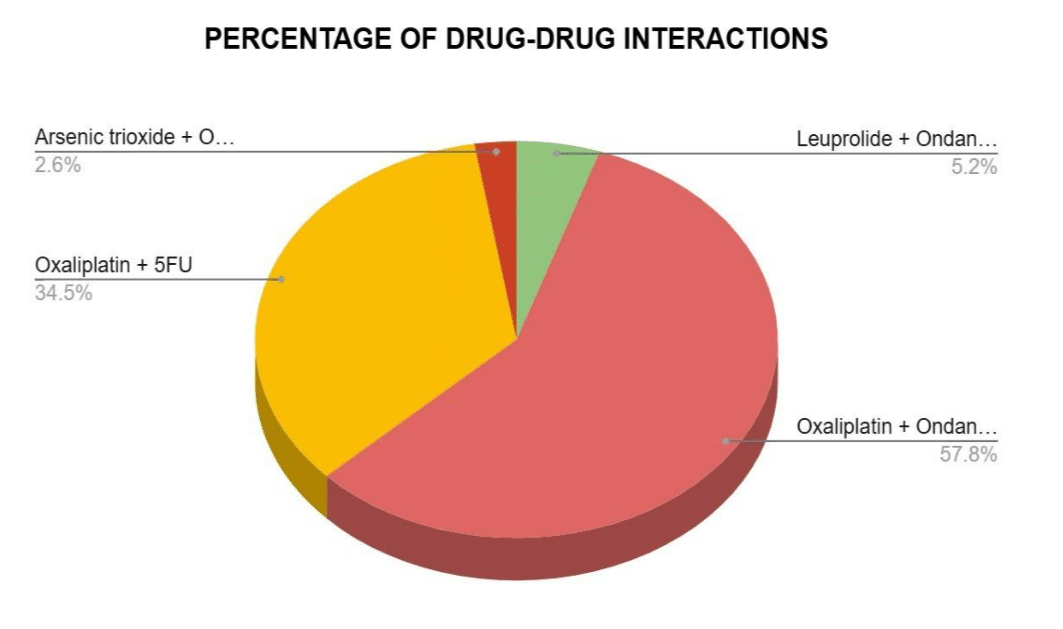
Figure 9: Frequency and percentage of DDIs
Age-wise distribution of DRPs: The distribution of DRPs across age groups shows that the highest number of DRPs was observed in the 66-75 age group with 101 cases, followed by the 46-55 age group with 72 cases, while the 16-25 age group had no reported DRPs.
| Age groups (Years) | Frequency(N=325) | Percentage (%) |
| 5-15 | 10 | 3.0% |
| 16-25 | 0 | 0% |
| 26-35 | 11 | 3.3% |
| 36-45 | 57 | 17.5% |
| 46-55 | 72 | 22.1% |
| 56-65 | 63 | 19.3% |
| 66-75 | 101 | 31.0% |
| 76-85 | 11 | 3.3% |
Table 13: Frequency and percentage of DRPs based on age
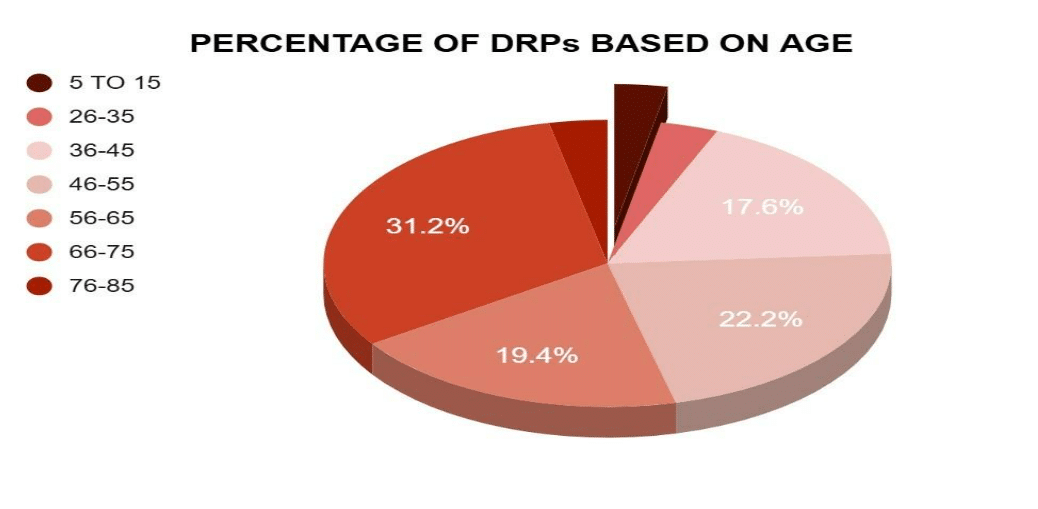
Figure 10: Frequency and percentage of DRPs based on age
Gender wise distribution of DRPs: The study revealed that the number of cases with drug-related problems (DRPs) was higher in males, with 48 cases compared to 40 cases in females.
| Gender | Frequency (N) | Percentage (%) |
| Males | 48 | 54.50% |
| Females | 40 | 45.40% |
| Total | 88 | 100% |
Table 14: Frequency and percentage of DRPs based on gender
Figure 11: Frequency and percentage of DRPs based on gender
Distribution of DRPs based on type of cancer: The study revealed that the drug-related problems were most common in stomach cancer patients, followed by breast cancer, and the least DRPs were found in nasopharyngeal cancer.
| Type of cancer | Frequency(N=325) | Percentage (%) |
| Breast | 42 | 12.9% |
| Prostate | 18 | 5.5% |
| Lung | 15 | 4.6% |
| Stomach | 59 | 18.1% |
| Leukemia | 33 | 10.1% |
| Lymphoma | 13 | 4.0% |
| Myeloma | 15 | 4.6% |
| Nasopharyngeal | 1 | 0.3% |
| Rectosigmoid | 27 | 8.3% |
| Ovary | 9 | 2.7% |
| Colon | 26 | 8.0% |
| Pancreatic | 15 | 4.6% |
| Brain | 2 | 0.6% |
| Esophageal | 4 | 1.2% |
| Cervical | 12 | 3.6% |
| Gallbladder | 2 | 0.6% |
| Oral | 11 | 3.3% |
| Others | 21 | 6.4% |
Table 15: Frequency and percentage of DRPs based on type of cancer
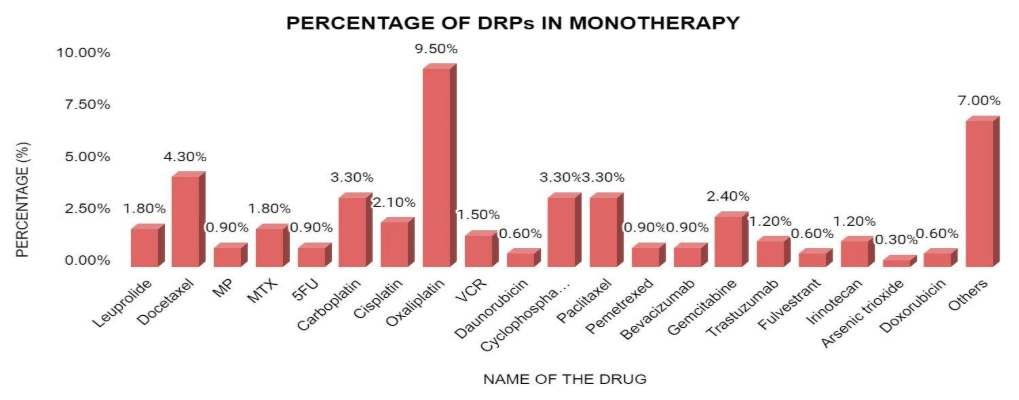
Figure 12: Frequency and percentage of DRPs based on type of cancer
Frequency of DRPs based on types of therapy: The study revealed that the majority of DRPs were associated with monotherapy (44.4%). It suggests that while monotherapy was the most frequently used approach, it also had the highest occurrence of DRPs compared to other therapy types.
| Type of therapy | Frequency(N) | Percentage (%) |
| Monotherapy | 160 | 44.4% |
| Combination | 154 | 42.7% |
| Supportive | 46 | 12.7% |
Table 16: Frequency and percentage of DRPs based on types of therapy
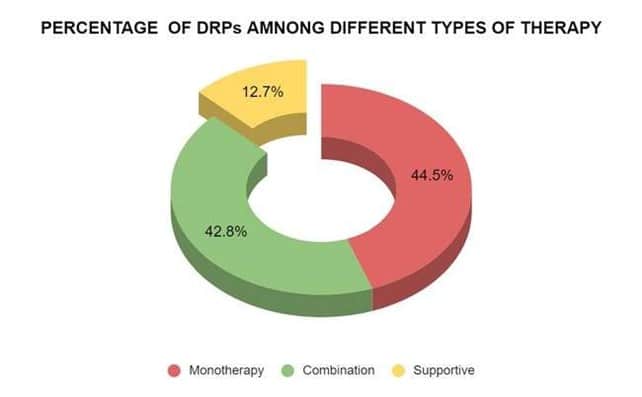
Figure 13: Frequency and percentage of DRPs based on types of therapy
Frequency of DRPs in monotherapy: In monotherapy, the drugs most frequently causing DRPs were Oxaliplatin, followed by docetaxel.
| S.No | Name of the drug | Frequency (N) | Percentage (%) |
| 1 | Leuprolide | 6 | 1.8% |
| 2 | Docetaxel | 14 | 4.3% |
| 3 | Melphalan and Prednisone | 3 | 0.9% |
| 4 | Methotrexate | 6 | 1.8% |
| 5 | 5-Fluorouracil | 3 | 0.9% |
| 6 | Carboplatin | 11 | 3.3% |
| 7 | Cisplatin | 7 | 2.1% |
| 8 | Oxaliplatin | 31 | 9.5% |
| 9 | Vincristine | 5 | 1.5% |
| 10 | Daunorubicin | 2 | 0.6% |
| 11 | Cyclophosphamide | 11 | 3.3% |
| 12 | Paclitaxel | 11 | 3.3% |
| 13 | Pemetrexed | 3 | 0.9% |
| 14 | Bevacizumab | 3 | 0.9% |
| 15 | Gemcitabine | 8 | 2.4% |
| 16 | Trastuzumab | 4 | 1.2% |
| 17 | Fulvestrant | 2 | 0.6% |
| 18 | Irinotecan | 4 | 1.2% |
| 19 | Arsenic trioxide | 1 | 0.3% |
| 20 | Doxorubicin | 2 | 0.6% |
| 21 | Others | 23 | 7.0% |
Table 17: Frequency and percentage of DRPs in monotherapy
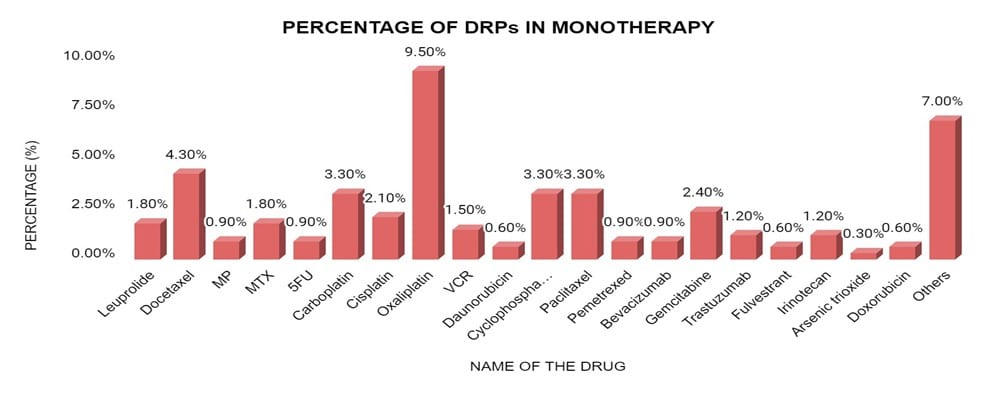
Figure 14: Frequency and percentage of DRPs in monotherapy
DRPs in combination therapy: The most frequent DRPs in combination therapy were associated with FOLFLOX, followed by paclitaxel + carboplatin/cisplatin.
| S.No | Name of the drug | Frequency(N) | Percentage (%) |
| 1 | CyBorD (Cyclophosphamide+bortezomib+dexamethasone) | 15 | 4.6% |
| 2 | Paclitaxel+ carboplatin / cisplatin | 27 | 8.3% |
| 3 | FOLFLOX (Folinic acid+fluorouracil+oxaliplatin) | 55 | 16.9% |
| 4 | R-CHOP
(Rituximab+cyclophosphamide+doxorubicin+vincristine+prednisolone) |
12 | 3.6% |
| 5 | Etoposide+ carboplatin | 6 | 1.8% |
| 6 | FOLFIRI (Folinic acid+fluorouracil+irinotecan) | 2 | 0.6% |
| 7 | BEP (Bleomycin+etoposide+platinum coordination agent) | 2 | 0.6% |
| 8 | ABVD (Adriamycin+bleomycin+vinblastine+dacarbazine) | 4 | 1.2% |
| 9 | Carboplatin + docetaxel | 3 | 0.9% |
| 10 | CAPEOX (Capecitabine+etoposide+oxaliplatin) | 2 | 0.6% |
| 11 | Carboplatin+gemcitabine | 2 | 0.6% |
| 12 | CAPIRI (Capecitabine+irinotecan) | 2 | 0.6% |
| 13 | CHOP
(Cyclophosphamide+doxorubicin+vincristine+prednisolone) |
2 | 0.6% |
| 14 | FOLFIRINOX (Folinic acid+fluorouracil+irinotecan+oxaliplatin) | 2 | 0.6% |
| 15 | Others | 18 | 5.5% |
Table 18: Frequency and percentage of DRPs in combination therapy
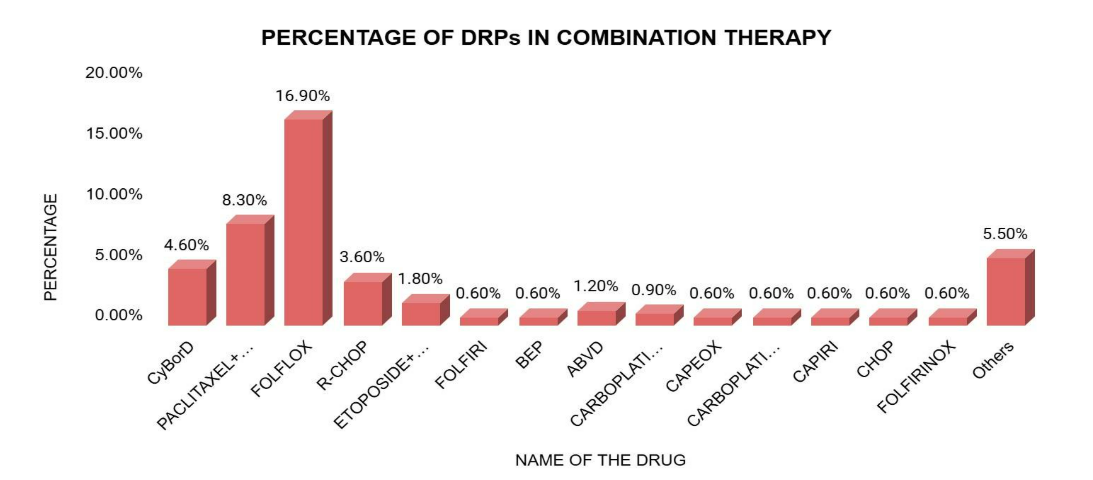
Figure 15: Frequency and percentage of DRPs in combination therapy
DRPs in supportive therapy: In supportive therapy, Ondansetron was commonly associated with DRPs.
| S.No | Drugs | No of DRPs | Percentage (%) |
| 1 | Ondansetron | 31 | 9.5% |
| 2 | Pantoprazole | 3 | 0.9% |
| 3 | Pheniramine | 0 | – |
| 4 | Fosaprepitant | 0 | – |
| 5 | Aprepitant | 0 | – |
| 6 | Calcium gluconate | 0 | – |
| 7 | Magnesium sulfate | 0 | – |
| 8 | Netupitant + Palonosetron | 1 | 0.3% |
| 9 | Hydrocortisone | 2 | 0.6% |
| 10 | Dexamethasone | 7 | 2.1% |
| 11 | Prednisolone | 1 | 0.3% |
| 12 | Tramadol | 0 | – |
| 13 | Multivitamin(Opti neuron) | 0 | – |
| 14 | Atropine | 0 | – |
| 15 | Kcl+mgso4 | 0 | – |
| 16 | Mannitol | 0 | – |
| 17 | Sodium-2 diphenylmethane sulphonate | 0 | – |
| 18 | Lactic acid bacillus | 0 | – |
| 19 | Racecadotril | 0 | – |
| 20 | Ursodeoxycholic acid | 0 | – |
| 21 | Disodium hydrogen citrate | 0 | – |
| 22 | Sulfamethoxazole +
Trimethoprim |
1 | 0.3% |
| 23 | Paracetamol | 0 | – |
| 24 | Ferric carboxymaltose | 0 | – |
| 25 | Buscopan | 0 | – |
Table 19: Frequency and percentage of DRPs in supportive therapy
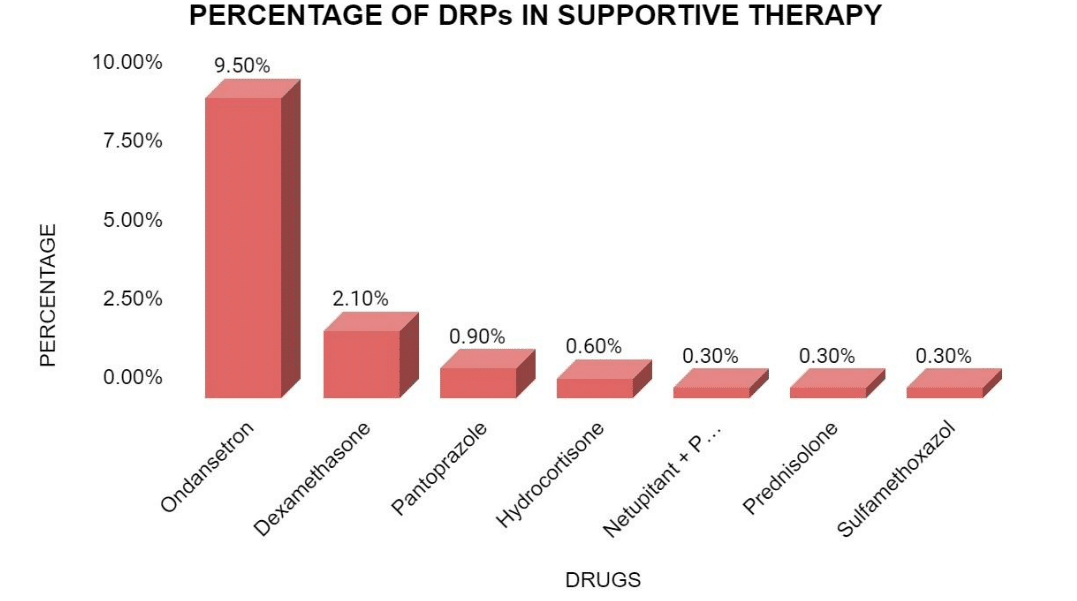
Figure 16: Frequency and percentage of DRPs in supportive therapy
Treated and untreated DRPs: In this study, out of 325 DRPs, 34.4% of DRPs were treated and 65.5% were untreated.
| DRPs | ADRs | Drug interactions | Dosing errors | Percentage(%) |
| Treated | 74 | 38 | 0 | 34.4% |
| Untreated | 191 | 0 | 22 | 65.5% |
Table 20: Percentage of treated and untreated DRPs
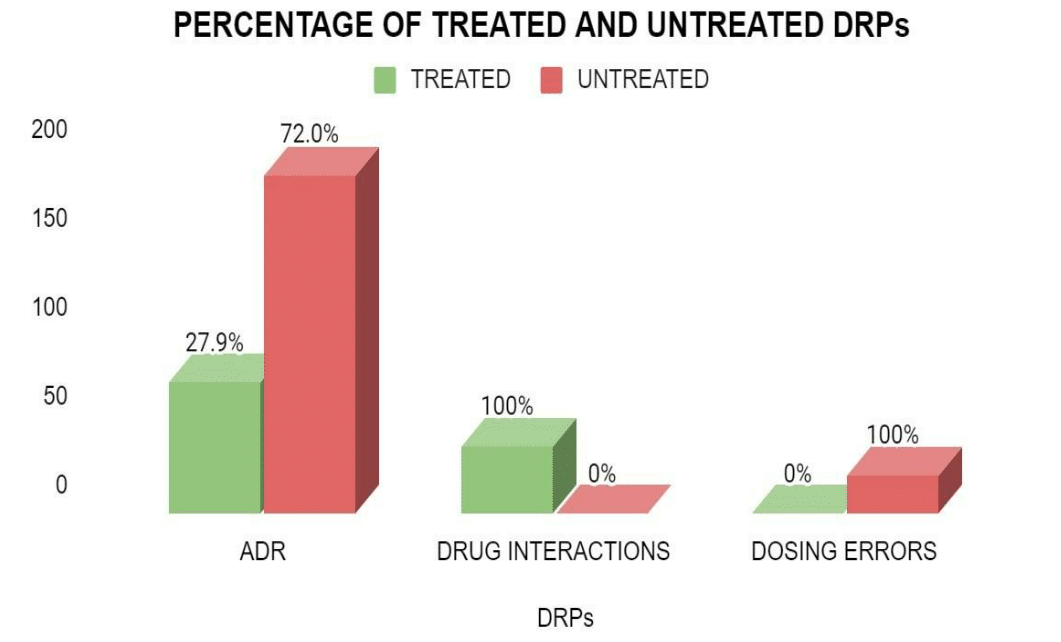
Figure 17: Percentage of treated and untreated DRPs
Discussion
A total of 107 patients were analyzed in a tertiary care hospital during a study period of six months. Of them, 88 patients have reported 325 drug-related problems in total, and 19 patients were without DRPs, resulting in a prevalence rate of 82.2%. In this study, the most prevalent DRP was ADRs, which occurred in 72.8% of patients (61.9% of the total DRPs), which was similar to the study done by Ayalew Sisay et al.[12] in which the most prevalent DRP was ADRs in cancer chemotherapy.
In the study, most cancer patients were diagnosed in the age group of 66-75 years (25.2%;n=27), 5665 years (23.3%;n=25), and the least affected age groups were 76-85years (3.7%;n=4), 5-15years (3.7%; n=4), which was similar to the study done by Murugavel Kanchana et al.[13] The study showed that the highest incidence was observed for breast cancer, cervical cancer, ovarian cancer in females due to hormonal status, chronic infection, overweight and obesity, low BSA and less physical activities, were as highest incidence of stomach cancer, lung cancer, rectosigmoid cancer, oral cancer, lymphoma and other type of cancers were most commonly diagnosed cancers in males due to social habits like cigarette smoking, alcohol consumption, unhealthy lifestyle, occupational risk, which was similar to study by Guduru H etal.[14]
In this study, out of 107 prescriptions, the maximum no. of patients were prescribed with platinum coordination complexes (23.9%;n=61), microtubule-damaging agents (17.2%;n=44), and anti-metabolites (13.3%;n=34), which was similar to the study done by Harshendra Guduru et al.[14] The commonly prescribed anticancer drugs were platinum coordination complexes and microtubule-damaging agents. In this study, 44.2% of DRPs were found in patients receiving monotherapy, 40.9% were found with Combination therapy, and 14% with supportive therapy. In this study, 54.5% of DRPs were found in males and 45.4% were found in female patients, which was similar to study done by Ayalew SisayE, etal.[12]in which males (51.1%) were highly prone to DRPS than females (48.8%).
In this study, the most frequently observed DRPs were in the age group of 66-75 years, which was similar to the study by Yeoh T.T. et al.[15] where 90.1% of elderly patients experienced DRPs. In relation to organ systems, Hematological system (50.56%, n=134), GI system (14.71%, n=39) were the mostly affected anatomical systems by ADRs occurred due to the chemotherapeutic drugs. The least affected systems were the nervous system (1.88%, n=5), respiratory system (1.88%, n=5), CVS (1.88%, n=5), and endocrine system (0.75%, n=2). By using the severity assessment scale (CTCAE 5.0), ADRs were categorized into different Grades. Among which majority of the reactions fall under Grade-I (Mild, 54.3%, n=144), Grade – II (Moderate,35.0%, n=93) which don’t warrant stopping or changing of drugs but few reactions were categorized under Grade-III (Severe, 10.1%, n=27) and reactions of Grade-IV (0.3%, n=1) were least commonly observed which pose the patients to life-threatening situations.
In this study, out of 22 dosing errors, 81.8% of subjects received an underdose and 18.1% were overdosed. In this study, a total of 325 DRPs were identified. Of which 34.4% of DRPs were treated (Severe and life-threatening) and 65.5% were untreated, as they are generally self-limiting, and they do not significantly impact the patient’s health or quality of life.
In 2022, Sarah Nabil et al.[16] studied A Pharmaceutical Care Plan to Minimize the Incidence of Potential DRPs in cancer patients. This study focused on the role of clinical pharmacists in implementing education for prescribers and its impact on DRPs related to prescribing errors and QoL scores. They obtained 500 prescriptions from the pre-education phase, the education phase, and the post-education phase and analyzed for the prevalence of DRPs. In the pre-education phase, at least 433 patients (scoring <33.3%) had issues in at least one domain of the functional scales. After the education phase, this number decreased by 23%, indicating fewer patients with problems. Similarly, in the symptom scales, there was a statistically significant improvement, as the number of patients scoring >66.7% decreased significantly in most domains post-education. Initially, at least 225 patients had problems (scoring >66.7%) in at least one domain of the symptom scale, and this number decreased by 42% after education. This underscores the positive impact of clinical pharmacy education on quality of life, as it enables pharmacists to review and consult with physicians, reducing prescribing errors.
In 2017, Colombo LRP et al.[17] studied the effects of pharmacist interventions on adult outpatients with cancer: This study revealed that most of the evidence on clinical pharmacist services for adult outpatients with cancer originated from studies in the United States. These studies primarily involved patients over the age of 50 diagnosed with genitourinary cancer. Pharmacist interventions mainly involved educating and counseling patients about their treatment, particularly in managing adverse events. Rates of nausea and vomiting control, patient satisfaction, and medication adherence were the most frequently measured outcomes, and almost all studies showed significant improvement in these parameters due to pharmacist interventions.
In 2021, Su YJ et al.[18] studied DRPs among hospitalized cancer pain patients: An investigative single-arm intervention trial. Through this study, they concluded that clinical pharmacists had identified DRPs in cancer patients and provided interventions based on their medication history interview and word rounds with multidisciplinary teams. Totally, 42 cancer patients were included, and 47 DRPs in 33 patients were identified. The major types of DRPs identified were treatment effectiveness and treatment safety. In case of treatment effectiveness, the effect of drug treatment was not optimal, and most of the DRPs were caused by drug selection and dose selection, which included no or incomplete drug treatment despite existing indication. They found that in cancer patients, insufficient pain control was mainly caused by inappropriate selection and dosage of analgesics. Through the pharmacist’s interventions, these problems dramatically decreased and brought positive effects in cancer pain.[18]
Conclusion
Our findings indicated that cancer patients are one of the groups who are most at risk of developing DRPs. The data indicate that chemotherapeutic patients are at higher risk of experiencing DRPs, such as adverse effects, interactions, and dosing errors. According to the study, ADRs were the most common type of DRPs, followed by drug interactions and dosing errors. Furthermore, the study reveals that the use of anticancer drugs often results in the use of other agents to reduce or prevent side effects of the anticancer treatment, thereby increasing the interaction potential. The results of this study will provide baseline data about the age groups, genders affected by different types of cancers, and anatomical systems affected by chemotherapeutic regimens. Within the shortest study period, we observed that there is the highest incidence of ADRs associated with different grades in subjects who are undergoing chemotherapy. It was also identified that most of the ADRs were self-limiting and hence did not intervene.
The findings underscore the importance of careful monitoring for ADRs, especially in older adults and those receiving complex chemotherapeutic regimens. Tailored interventions to prevent DRPs should focus on patients with high-risk cancers like stomach and breast cancer. Hence, there is a need to optimize drug therapy, particularly in managing the balance between efficacy and safety of chemotherapeutic drugs, to minimize ADRs, drug interactions, and dosing errors.
References
- WHO. Cancer. 2025.
Cancer - Maslub MG, Radwan MA, Mikhail MS, et al. Assessment of the latest prescribed drug-related problems. Eur Rev Med Pharmacol Sci. 2022;26(7):2373-2387. doi:10.26355/eurrev_202204_28467
PubMed | Crossref | Google Scholar - Venugopal J, S S, A R, Karnan D. Drug-related problems in cancer patients: A systematic review. J Oncol Pharm Pract. 2024;30(3):562-571. doi:10.1177/10781552241229662 PubMed | Crossref | Google Scholar
- Kefale B, Engidaw MT, Tesfa D, Molla M, Yismaw MB. Management Practice and Drug Related Problems and Its Contributing Factors Among Cervical Cancer Patients at Oncologic Center in Ethiopia: A Hospital-Based Retrospective Study. Ther Clin Risk Manag. 2022;18:643-655. doi:10.2147/TCRM.S364923
PubMed | Crossref | Google Scholar - Su YJ, Yan YD, Wang WJ, et al. Drug-related problems among hospitalized cancer pain patients: an investigative single-arm intervention trial. Ann Palliat Med. 2021;10(2):2008-2017. doi:10.21037/apm-20-1458
PubMed | Crossref | Google Scholar - Kanchana M, Jovita PMM, Rajanandh MG. Drug-related problems and potentially inappropriate medications use in Indian geriatric patients receiving chemotherapy in the medical oncology unit of a tertiary care hospital. J Geriatr Oncol. 2021;12(5):840-843. doi:10.1016/j.jgo.2020.10.014
PubMed | Crossref | Google Scholar - Guduru H, Jeevanagi SKR, Nigudgi S, Bhandare SV. A prospective study on the prescription pattern of anti-cancer drugs and adverse drug reaction in a tertiary care hospital. Int J Basic Clin Pharmacol. 2019;8(2):200–205. doi:10.18203/2319-2003.ijbcp20190134
Crossref | Google Scholar - van Mil JW, Westerlund LO, Hersberger KE, Schaefer MA. Drug-related problem classification systems. Ann Pharmacother. 2004;38(5):859-867. doi:10.1345/aph.1D182 PubMed | Crossref | Google Scholar
- Basger BJ, Moles RJ, Chen TF. Application of drug-related problem (DRP) classification systems: a review of the literature. Eur J Clin Pharmacol. 2014;70(7):799-815. doi:10.1007/s00228-014-1686-x
PubMed | Crossref | Google Scholar - Venugopal J, S S, A R, Karnan D. Drug-related problems in cancer patients: A systematic review. J Oncol Pharm Pract. 2024;30(3):562-571. doi:10.1177/10781552241229662 PubMed | Crossref | Google Scholar
- Zhang P, Lv D, Zhao J, Sun S, Li L, Liao Y. Evaluation of pharmacists’ interventions on drug-related problems and drug costs in patients with cancer pain. Int J Clin Pharm. 2021;43(5):1274-1282. doi:10.1007/s11096-021-01247-w
PubMed | Crossref | Google Scholar - Sisay EA, Engidawork E, Yesuf TA, Ketema EB. Drug related problems in chemotherapy of cancer patients. J Cancer Sci Ther. 2015;7(2). doi:10.4172/1948-5956.1000325 Crossref | Google Scholar
- Kanchana M, Jovita PMM, Rajanandh MG. Drug-related problems and potentially inappropriate medications use in Indian geriatric patients receiving chemotherapy in the medical oncology unit of a tertiary care hospital. J Geriatr Oncol. 2021;12(5):840-843. doi:10.1016/j.jgo.2020.10.014
PubMed | Crossref | Google Scholar - Guduru H, Jeevanagi SKR, Nigudgi S, Bhandare SV. A prospective study on the prescription pattern of anti-cancer drugs and adverse drug reaction in a tertiary care hospital. Int J Basic Clin Pharmacol. 2019;8(2):200-205. doi:10.18203/2319-2003.ijbcp20190134.
Crossref | Google Scholar - Yeoh TT, Tay XY, Si P, Chew L. Drug-related problems in elderly patients with cancer receiving outpatient chemotherapy. J Geriatr Oncol. 2015;6(4):280-287. doi:10.1016/j.jgo.2015.05.001
PubMed | Crossref | Google Scholar - Nabil S, El-Shitany NA, Shawki MA, et al. A pharmaceutical care plan to minimize the incidence of potential drug-related problems in cancer patients. Egypt J Hosp Med. 2022;89(1):4874-4880. doi:10.21608/ejhm.2022.260758
Crossref | Google Scholar - Colombo LRP, Aguiar PM, Lima TM, Storpirtis S. The effects of pharmacist interventions on adult outpatients with cancer: A systematic review. J Clin Pharm Ther. 2017;42(4):414-424. doi:10.1111/jcpt.12562
PubMed | Crossref | Google Scholar - Su YJ, Yan YD, Wang WJ, et al. Drug-related problems among hospitalized cancer pain patients: an investigative single-arm intervention trial. Ann Palliat Med. 2021;10(2):2008-2017. doi:10.21037/apm-20-1458
PubMed | Crossref | Google Scholar
Acknowledgments
We sincerely thank all who contributed to the successful completion of our project, “An Observational Study on Drug-Related Problems in the Treatment of Cancer Patients.” First and foremost, we thank Dr. Pradeep K Reddy, our guide and mentor, for his expert guidance, continuous support, and valuable insights that strengthened our understanding of clinical research in oncology.
We also thank the Department of Oncology and Clinical Pharmacy at Continental Hospital, Gachibowli, for providing the opportunity to conduct our study, and the medical staff, clinical pharmacists, and nursing teams for their cooperation during data collection.
We appreciate the Principal and Faculty of RBVRR Women’s College of Pharmacy, Hyderabad, for their support and resources. Finally, we acknowledge our families and friends for their consistent encouragement and support throughout this project.
Funding
Not available
Author Information
Corresponding Author:
Pradeep K Reddy Kistampally
Department of Medical Oncology
Continental Hospitals, Nanakramguda, Gachibowli, Hyderabad, Telangana, India
Email: [email protected]
Co-Authors:
Billakanti Raj Kumar
Department of General Surgery
SVS Medical College, Mahabubnagar, India
SP Shrivastava
Department of Medical Oncology
Kokilaben Hospital, Indore, India
Chiluveru Pragnya, Gannoju Shruthi, Samakura Madhavi, Thummala Varsha, Hajera Fatima
Department of Pharmacy Practice
RBVRR Women’s College of Pharmacy, Barkatpura, Hyderabad, Telangana, India
Niharika K
Department of Obstetrics & Gynecology
Continental Hospitals, Nanakramguda, Gachibowli, Hyderabad, Telangana, India
Ravi Teja B
Department of Medical Oncology
Continental Hospitals, Nanakramguda, Gachibowli, Hyderabad, Telangana, India
Authors Contributions
Dr. Pradeep K. Reddy conceptualized the study, designed the methodology, and led the manuscript writing. Chiluveru Pragnya co-conceptualized the study, contributed to the research design, and co-led the writing process. Gannoju Shruthi conducted the literature review and assisted in drafting the manuscript. Samakura Madhavi was responsible for data collection and analysis. Thummala Varsha contributed to data interpretation and critical revision of the manuscript. Dr. Hajera Fatima provided overall supervision, reviewed the final draft, and helped shape the research direction. All authors reviewed and approved the final version of the manuscript.
Ethical Approval
This study was approved by the Institutional ethics committee of Continental Hospitals (Ref: #CHL 18032024-022), Hyderabad, Telangana, India.
Conflict of Interest Statement
The authors declare no conflict of interest.
Guarantor
None
DOI
Cite this Article
Pradeep KRK, Raj KB, Shrivastava SP, et al. An Observational Study on Drug-Related Problems in the Treatment of Cancer Patients. medtigo J Med. 2025;3(2):e3062326. doi:10.63096/medtigo3062326 Crossref